The Dashboard database is the backbone of Metric Insights. It contains your metric data along with the definitions for all of your metrics and reports. It contains user information such as email addresses, group membership, and access permissions. It even contains usage data such as the number of elements viewed by each user, and performance data such as run-times for data collection triggers. All of this data can be set forth in metrics and reports, just like the data from any of your other sources. In this issue of Tips & Tricks, we’ll show you how.
The Dashboard Database
The first thing to do is to get an overview of the Dashboard database.That might be a daunting task, as the database contains more than 300 tables. Fortunately, most of the data that you’ll need can be found in a handful of key tables.
For example:
- dashboard_element: Element metatada such as name, fetch command, and creation date
- update_trigger_event_run_log_
detail: Element run statistics such as start time, finish time, and success indicator - user_element_view_log_detail: History of elements viewed by each user, including dates and times
Here are some other key tables:
- metric_measured_value
- segment_value
- source_database_connection
- update_trigger_event
- update_trigger_event_run_log
- user
- user_annotation
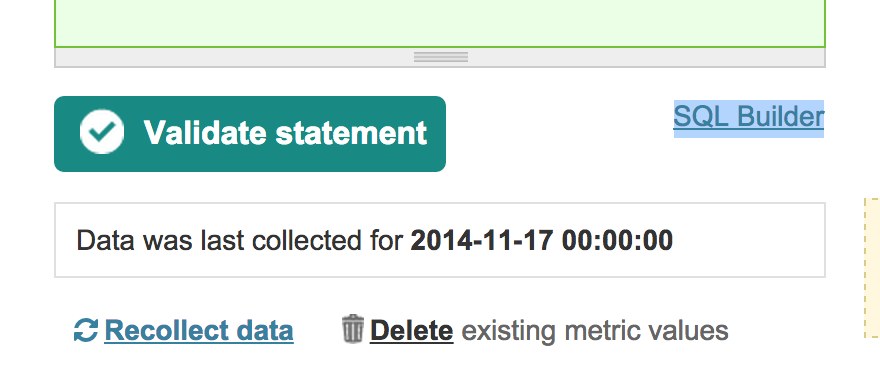
You can learn more about the Dashboard database by clicking the new SQL Builder link in the metric or report editor.
If you’ve selected the Dashboard DB as your data source, you’ll get a list of tables belonging to the Dashboard database. Drag any table onto the main screen to see a list of fields belonging to it. Drag fields from one table to another to create joins. Construct basic SQL queries by making selections from the drop-downs.
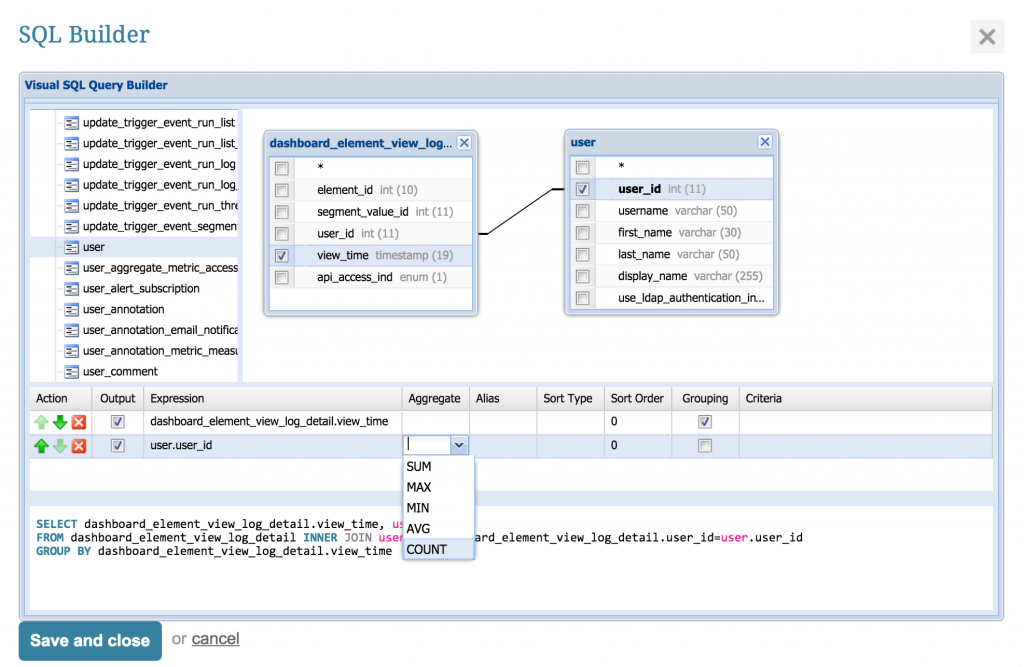
Note: The SQL Builder will work with any data source, not just the Dashboard database. It is included in version 3.1 of Metric Insights. If you don’t have version 3.1 yet, you can get a list of tables by creating a report whose SQL command is simply, ‘show tables’. Once you’ve found a table that interests you (e.g., dashboard_element), you can get a list of fields by creating a report whose SQL command is simply, ‘desc dashboard_element’.
Once you understand the key tables, you’ll be able to create a rich set of usage and performance reports. We’ll be happy to help you. In fact, we can even send you a file that you can use to create a starter set of reports. Please let us know if you’re interested!