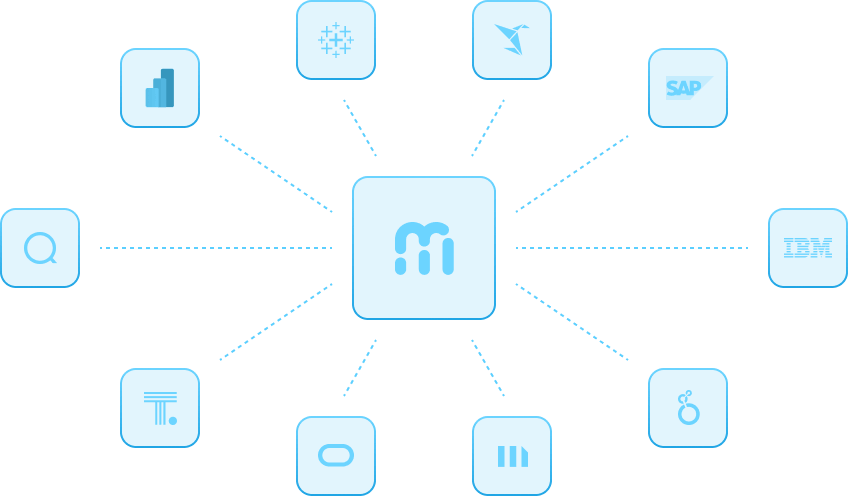
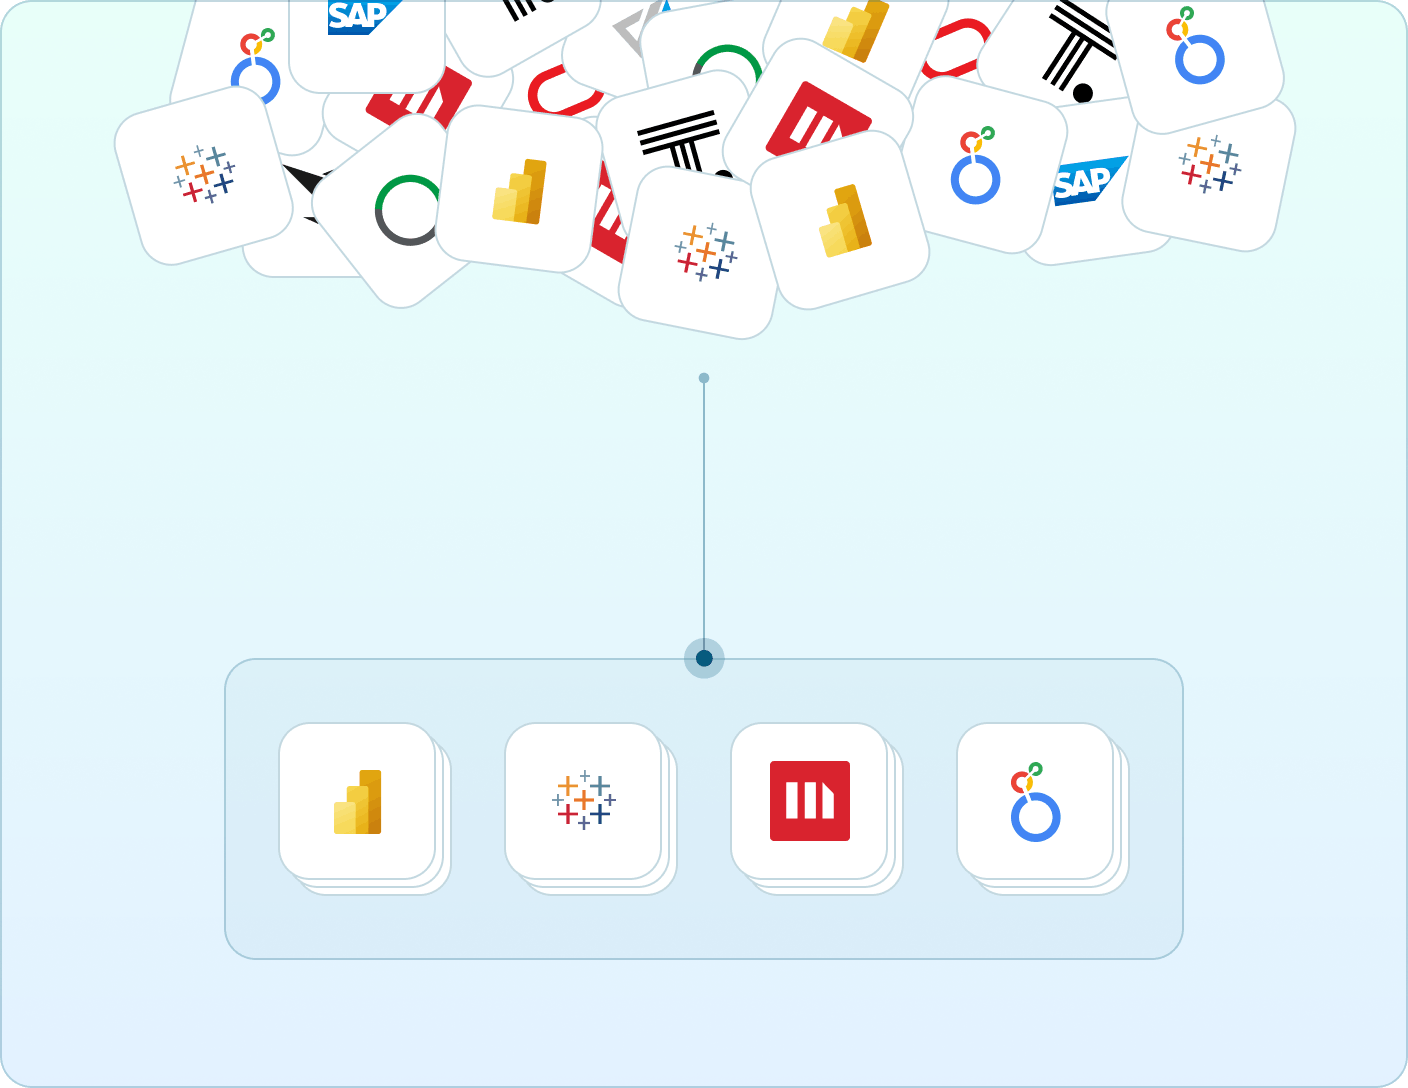
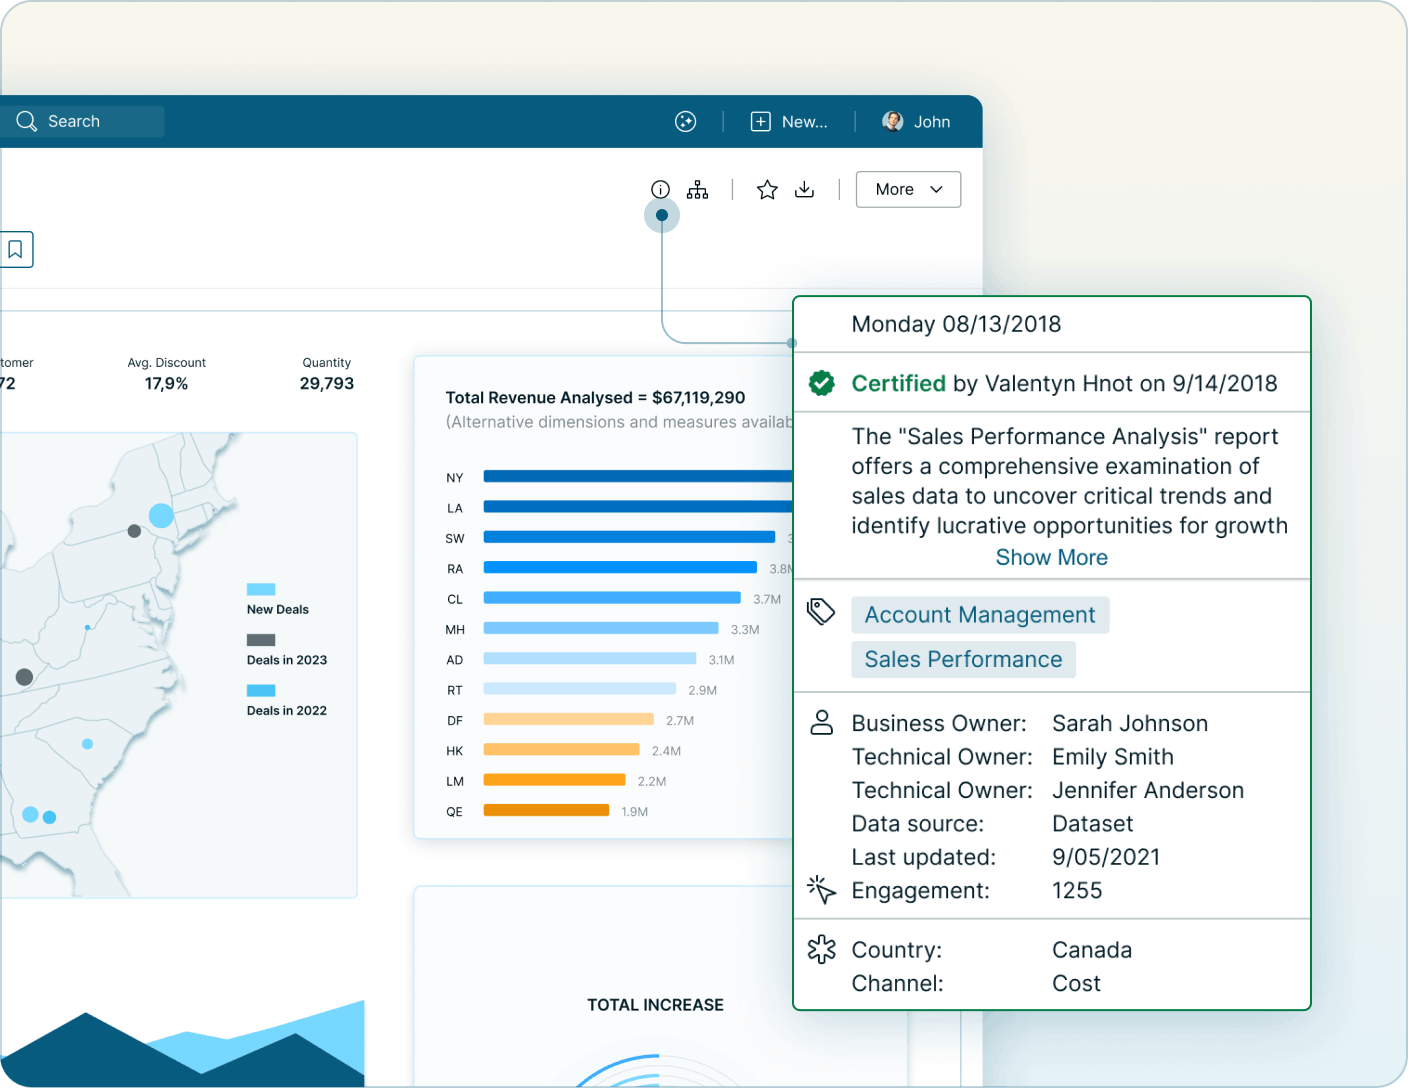
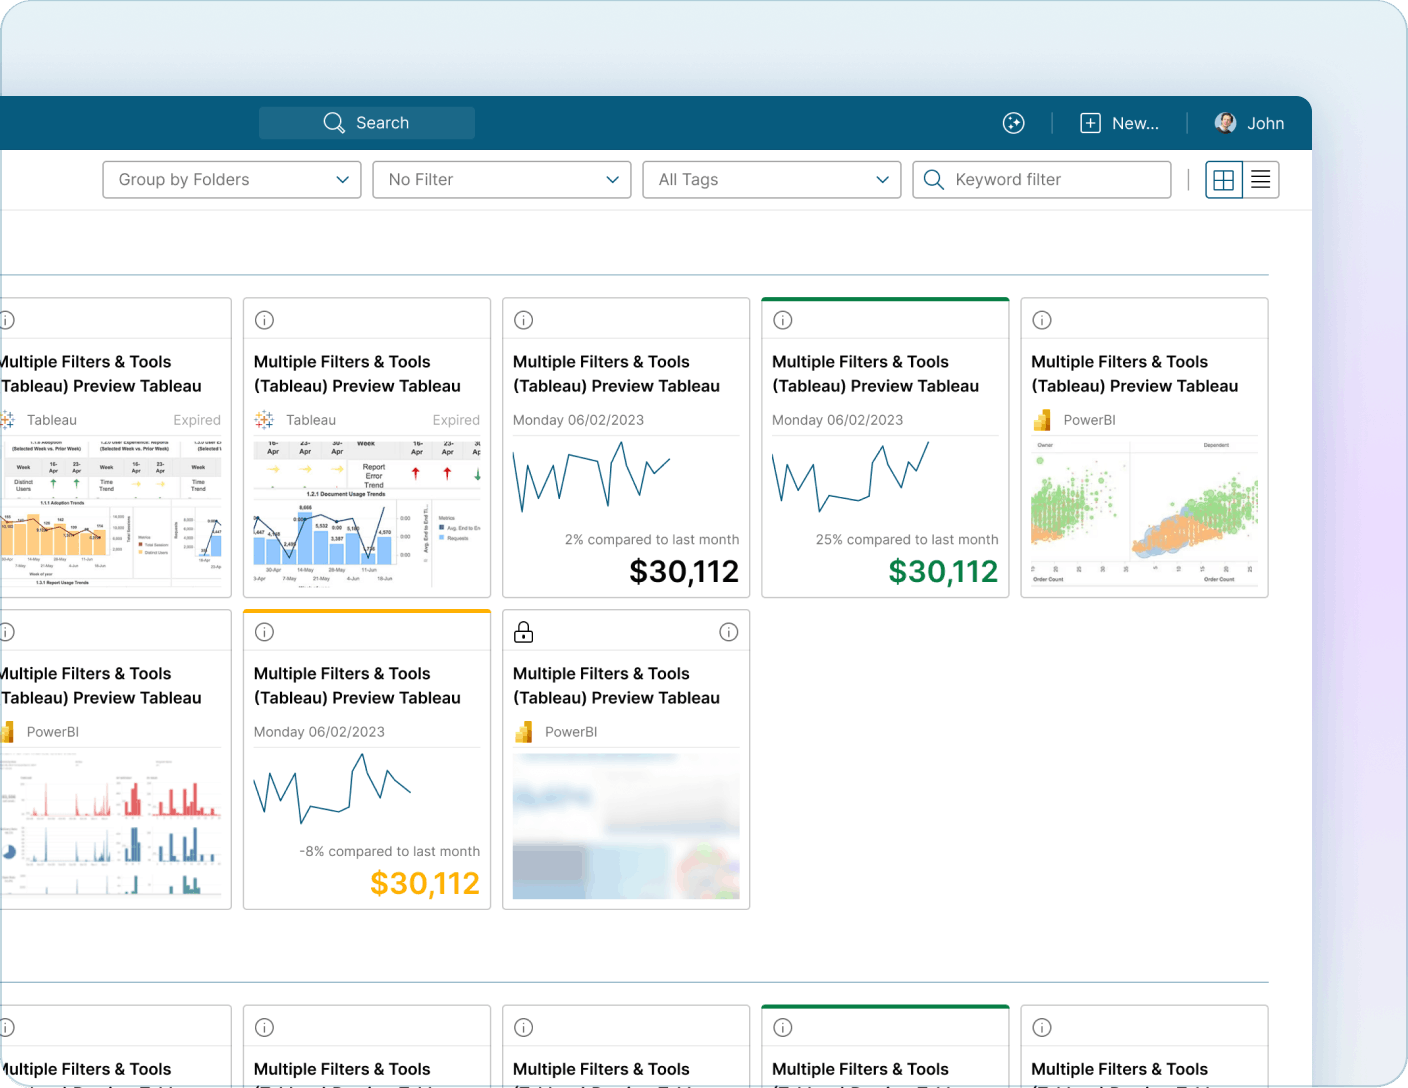
Users miss critical events in the data every day. With access to too many reports and dashboards, it is impossible for them to monitor every metric, all the time. Metric Insights Enterprise BI Portal works by integrating with your existing data, applications, and BI solutions ensuring your data gets the audience it deserves.
Certify and combine all your metrics, KPIs, reports, and dashboards into a consolidated Business Intelligence portal. Enable users to easily search and find the content that is most relevant to them.
Cut through the noise and send each user a personal digest email of significant changes in the data that is relevant to them. Combine and burst out content from multiple data sources, reporting and dashboard tools, on any schedule to ensure users have the information they need, when they need it.
Automatically profile all your metrics for statistical anomalies, or add your own rules and thresholds, to alert users when important outliers are triggered in the data. Notify users via email, SMS or mobile app, or trigger API calls to other systems.
Snapshot any set of data over time. Filter down large sets of data and dashboards to a small number of exceptions that users should focus their attention on.
“All of the information is in one place and easy to find,” “It’s clear and intuitive to use,” and “We have needed this for so long.”
“Metrics Insights is that little voice in your ear saying, ‘something might be wrong here'”
“The ability …with Metric Insights… to customize who sees what data, to make decisions to drive the business and to do our population health management, is critical”
“I use Push Intelligence to deliver Big Data analytics to hundreds of external partners. It is incredibly easy to use and requires very little training and support “
Ensure your users are acknowledging and acting upon alerts that are triggered by your data. Apply workflows to alerts that set a priority and status, and assign them to users who should take ownership. Be alerted to neglected events, and see a history of what happened with completed workflows.
Enable users to annotate charts at the data point level to share insights across your organization and ensure complete context is captured with your results.
Overlay calendars onto your data to show how business events are impacting your metrics & KPI’s. Reveal powerful correlations between metrics from multiple sources and see which events are causing anomalies and exceptions in the data.
Customize user experience with Portal Pages. Portal Pages allow users to create user-designed pages that feature highly relevant data.
The Metric Insights Slack App allows the integration of your Metric Insights system and Slack. You can enter search queries in a Slack Channel and have the app deliver content to that Channel based on the matches found in Metric Insights, or interact directly with the Slack App.