Metric Insights External Reports Tiles are objects within the Metric Insights Catalog that embed Business Intelligence (BI) content from any third-party BI tool directly within the BI Portal, providing users with a single location to access BI content, complete with comprehensive metadata and consistent functionality.
Supported Business Intelligence Tools
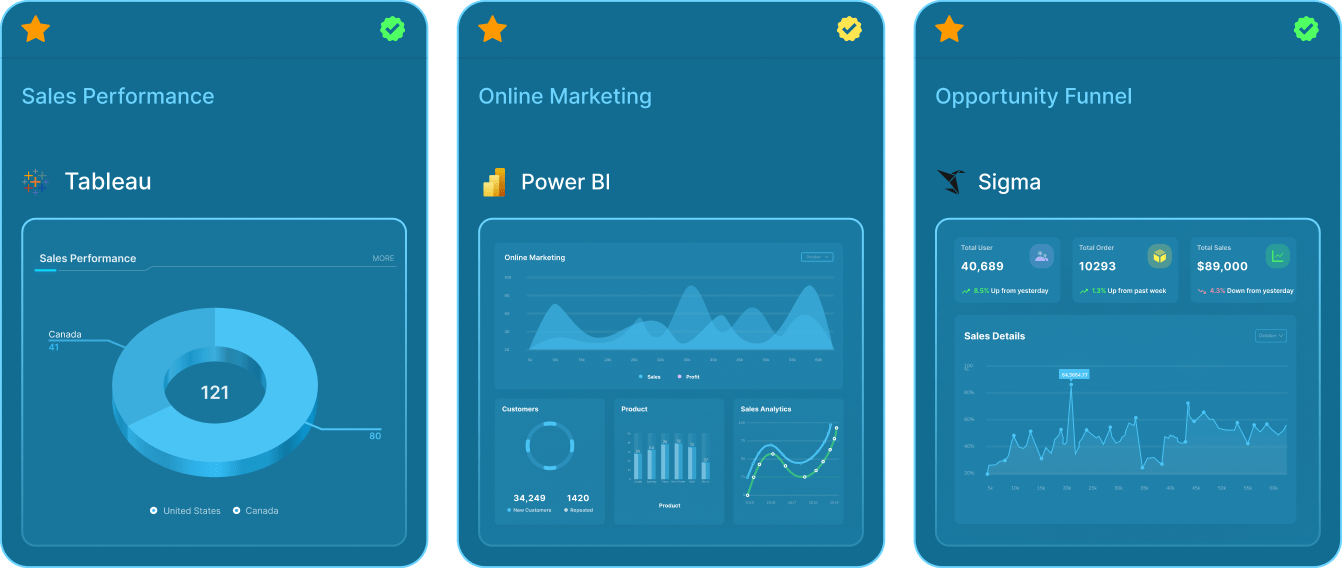
Metric Insights supports external reports from all types of Business Intelligence tools. This includes solutions that are both in the cloud and on-premise.
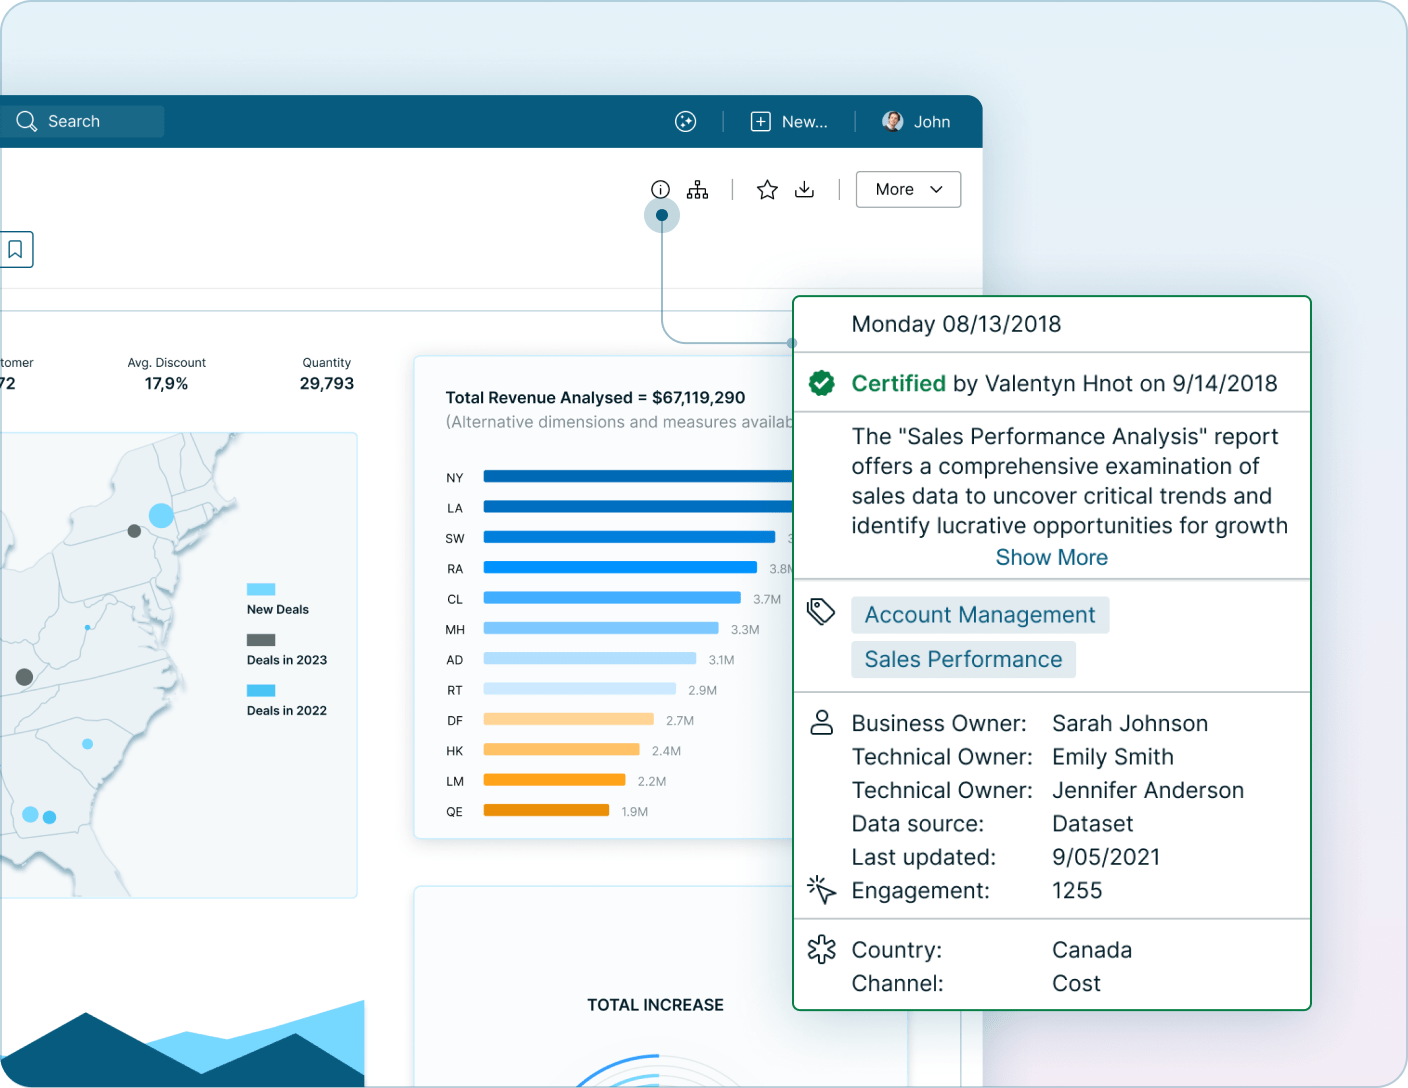
Assigning context to certified reports promotes data literacy and ensures that users understand the report's intended purpose. Metadata often includes tags, glossary terms, data classification and sensitivity, ownership, and other custom fields specific to your organization. Connect to your Data Catalog to pull in any existing metadata.
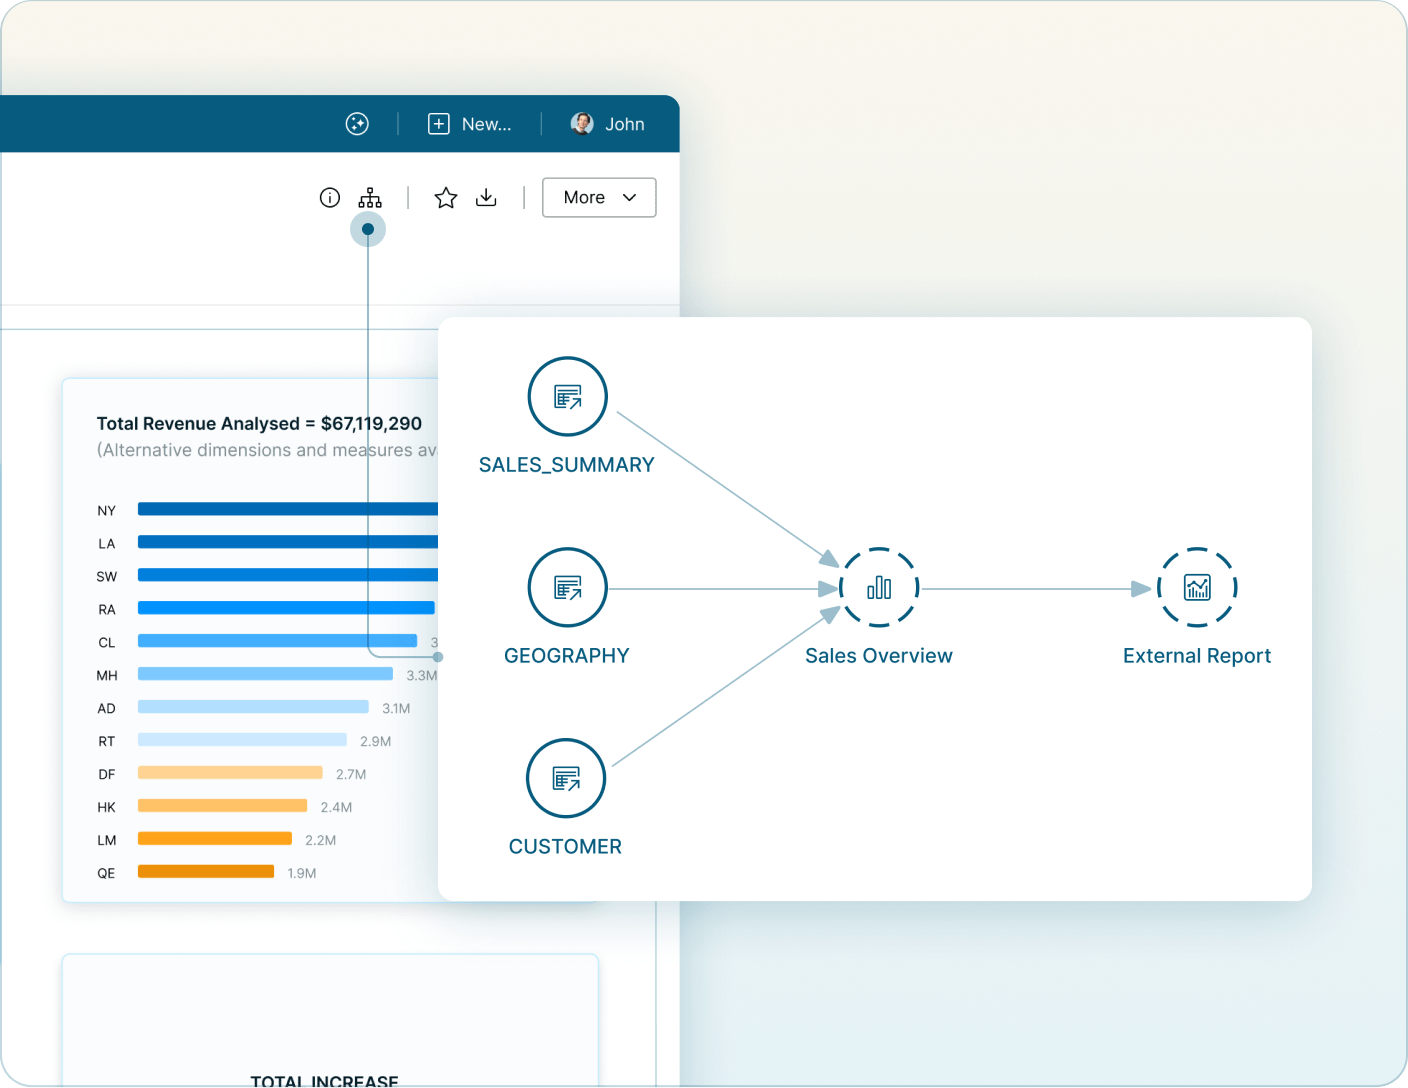
Lineage is critical in helping users understand the data that feeds a particular report. Specifically, it allows users to see which tables and models are feeding a report and whether that report is being used in any email Bursts.
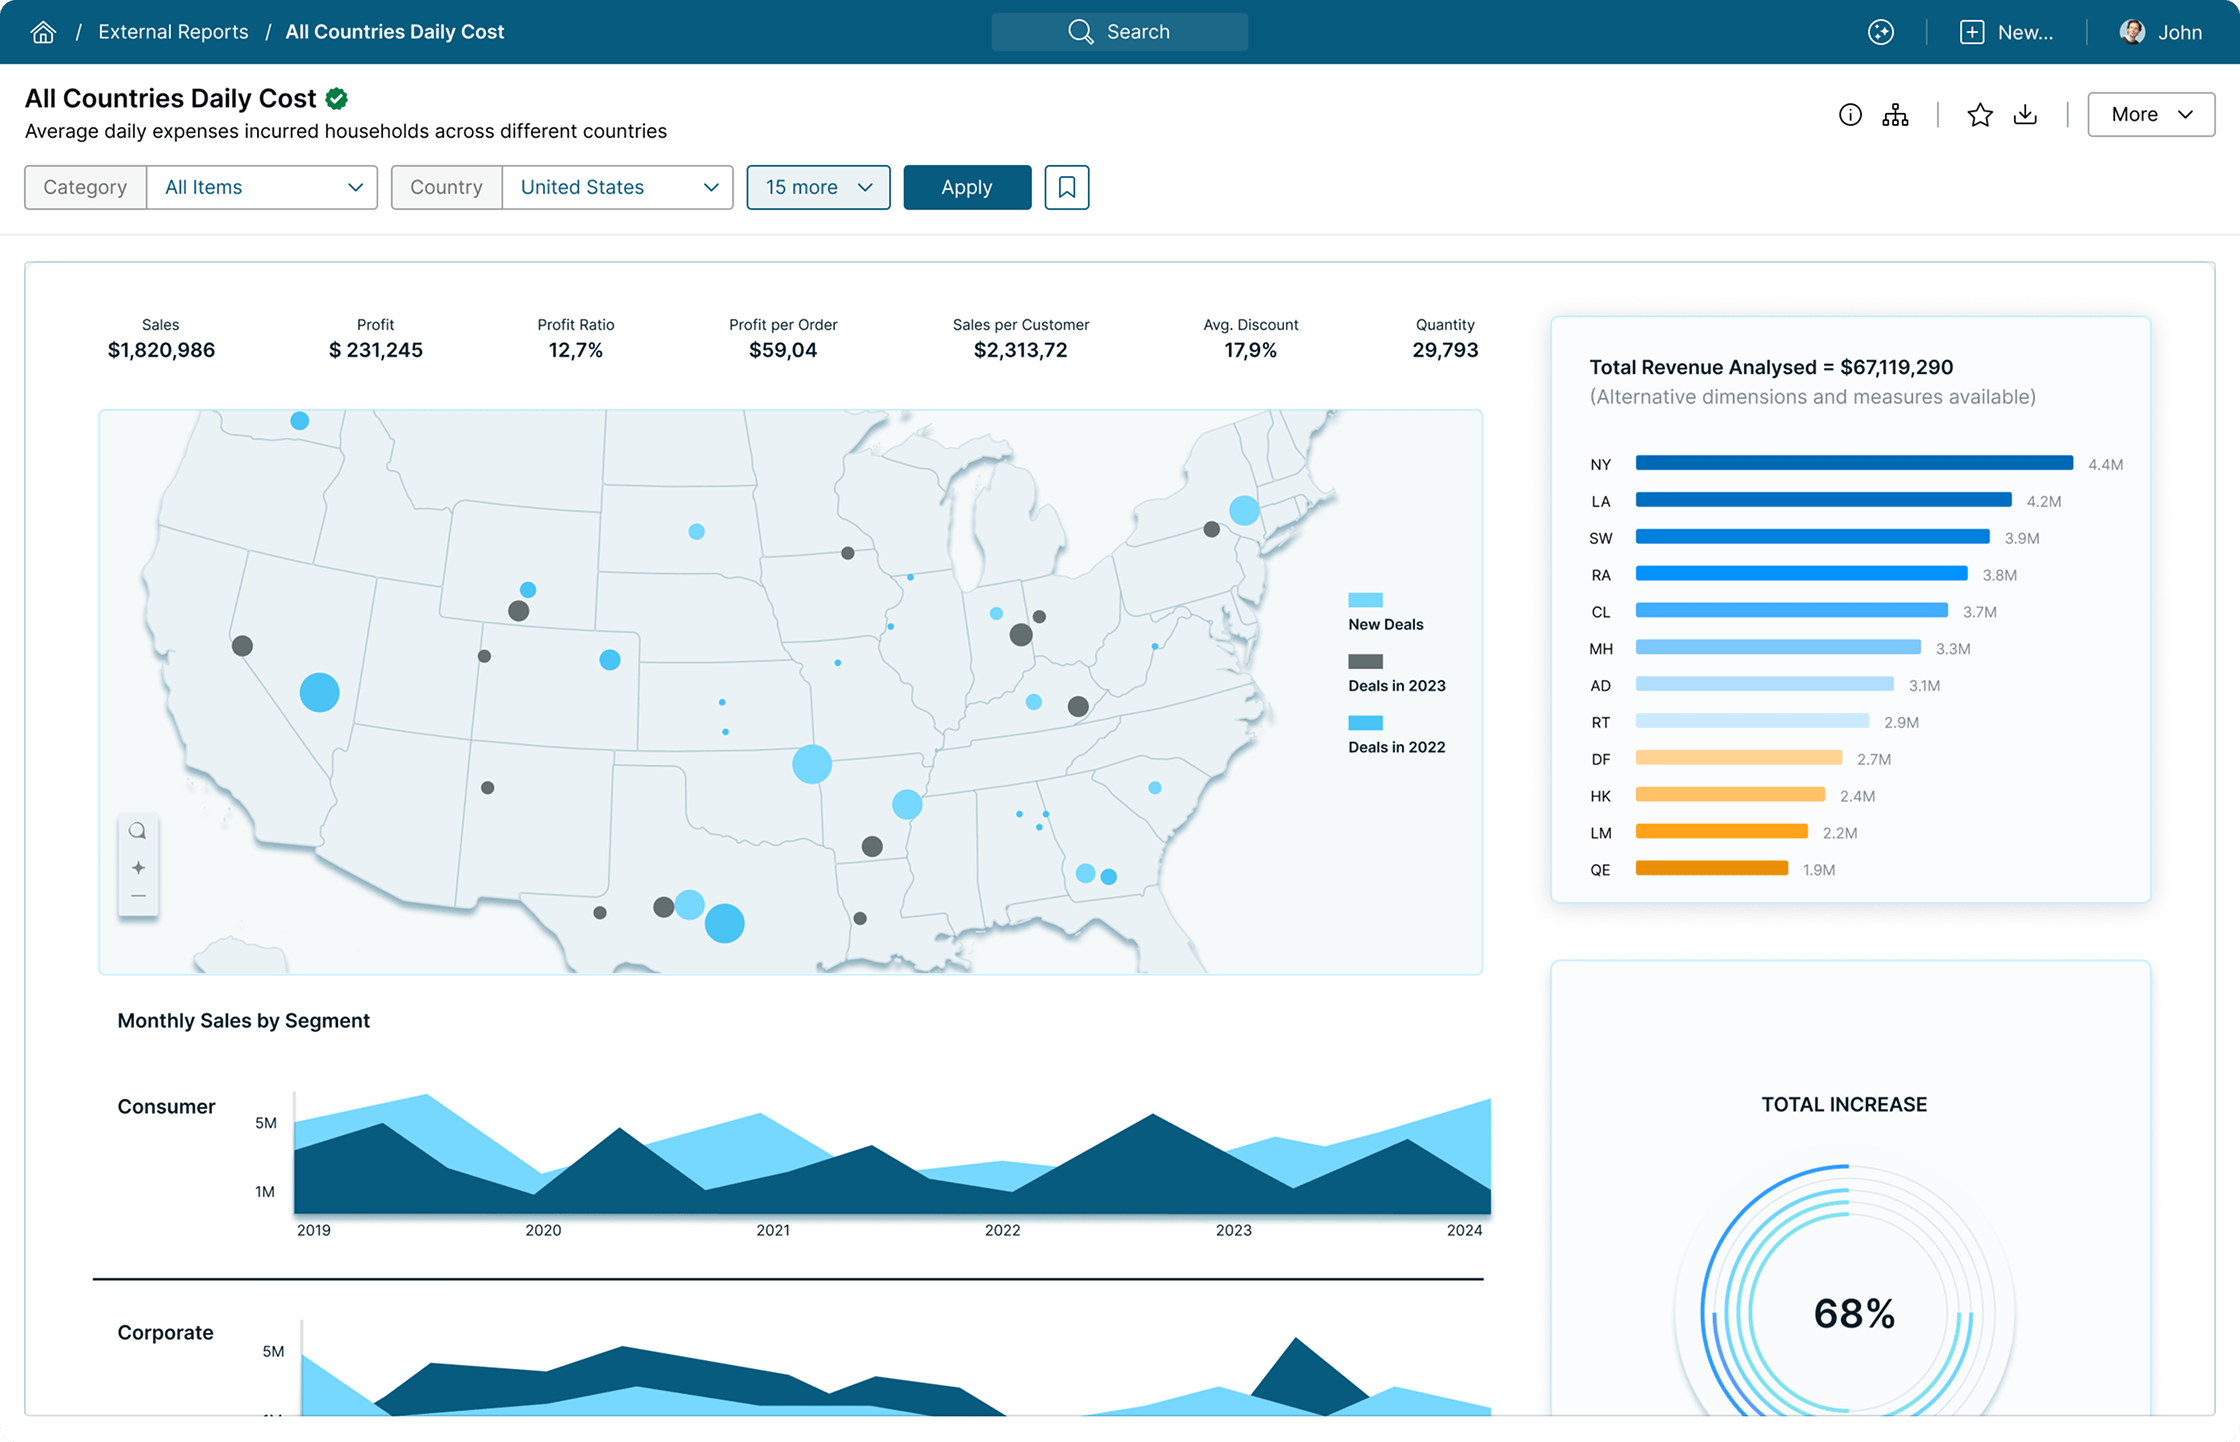
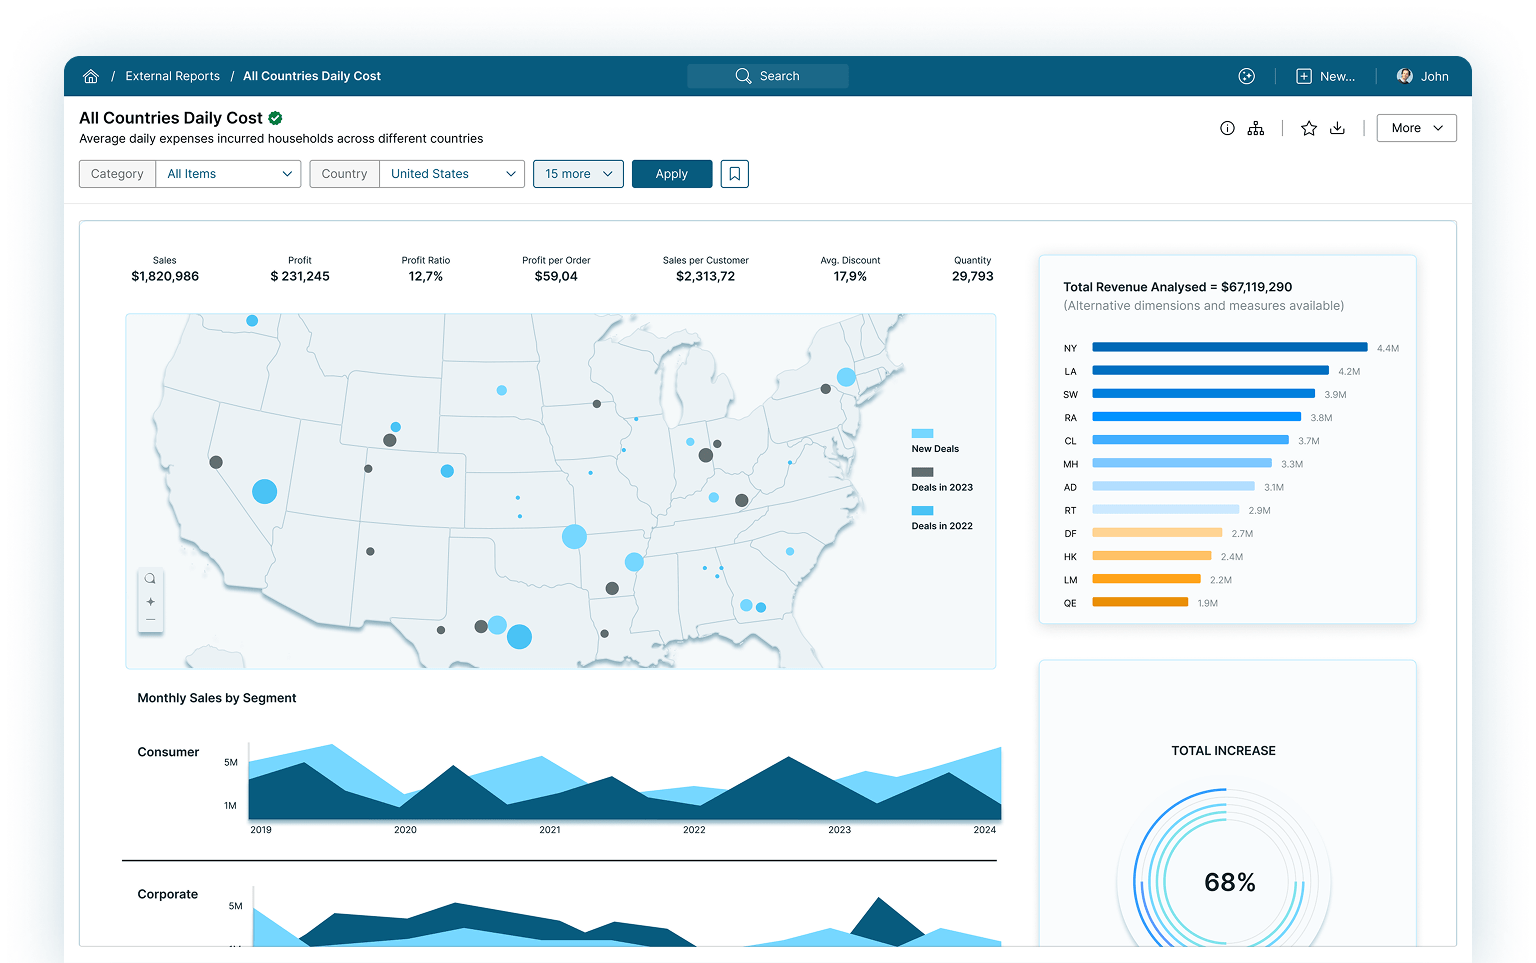
Global Filters
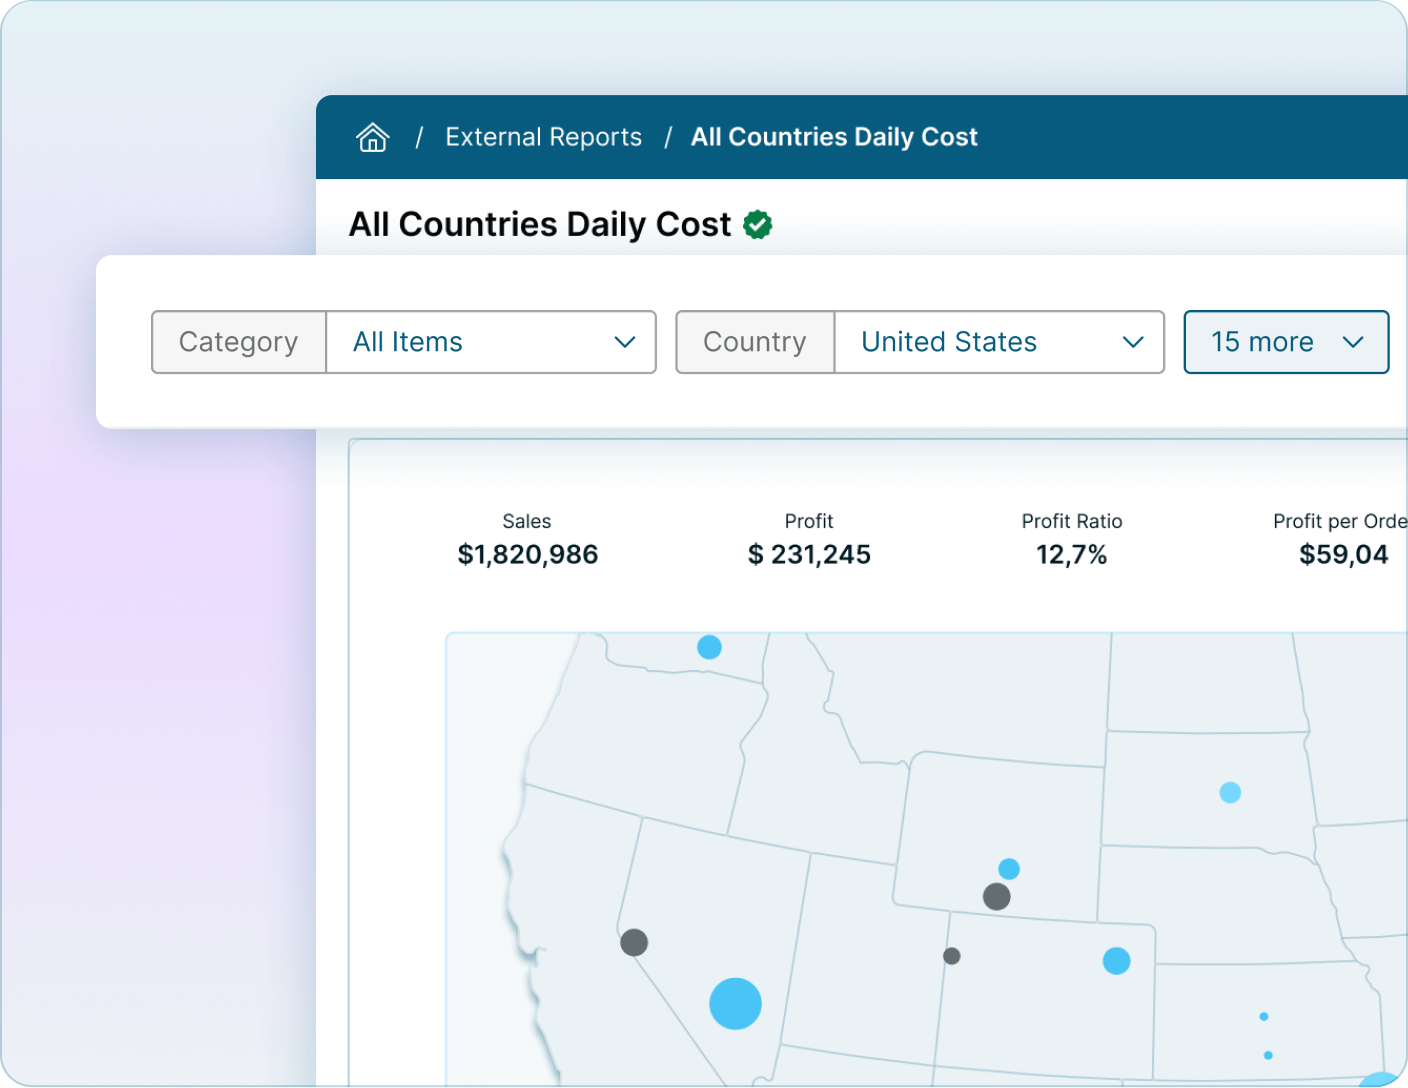
External Report filters map to filters within the underlying BI report, to provide a consistent way for users to slice and dice the data. User or Role-based defaults can be setup to personalize the report experience. Enabling Sticky Filters ensures that the filter context is retained as a user navigates to different reports and dashboards that contain the same filter, even if they are in different tools and technologies.
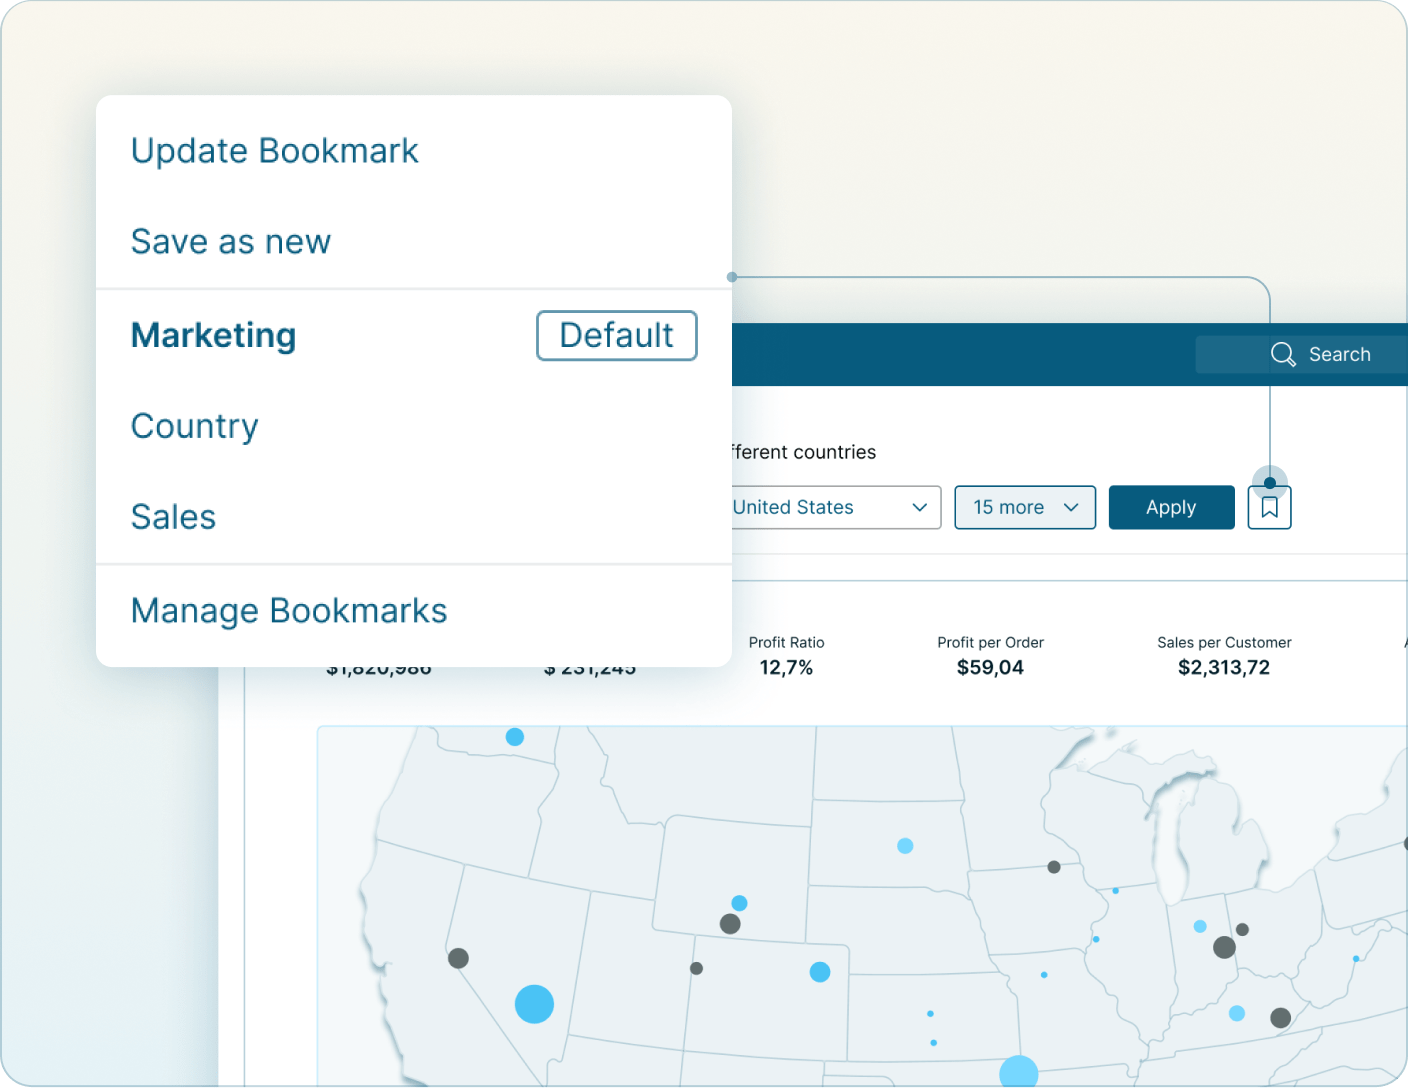
Bookmarking
Users can save custom filter combinations as Bookmarks within an External Report. These bookmarks are user-specific, meaning they are only accessible to the users who configured them. Users can also subscribe to a report with a Bookmark applied to receive a specific view of the data in their email.
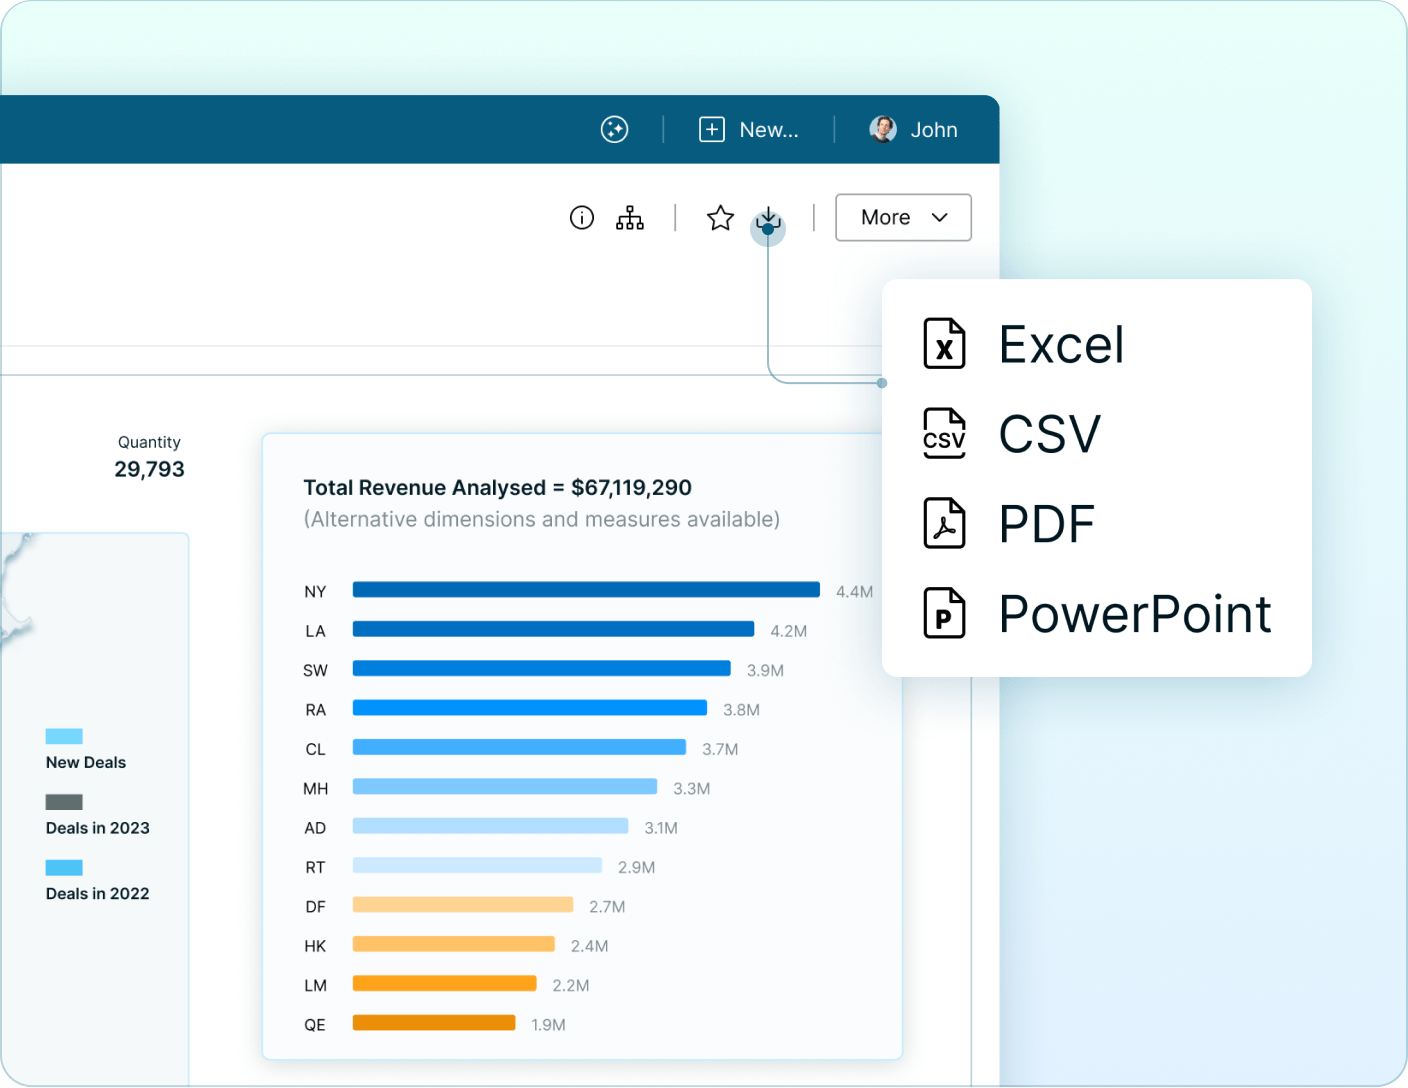
Downloads
A single and consistent download option gives users the ability to easily export a report or the data to Excel, CSV, PDF, or PowerPoint. Control download capabilities centrally based on the report and governance requirements.
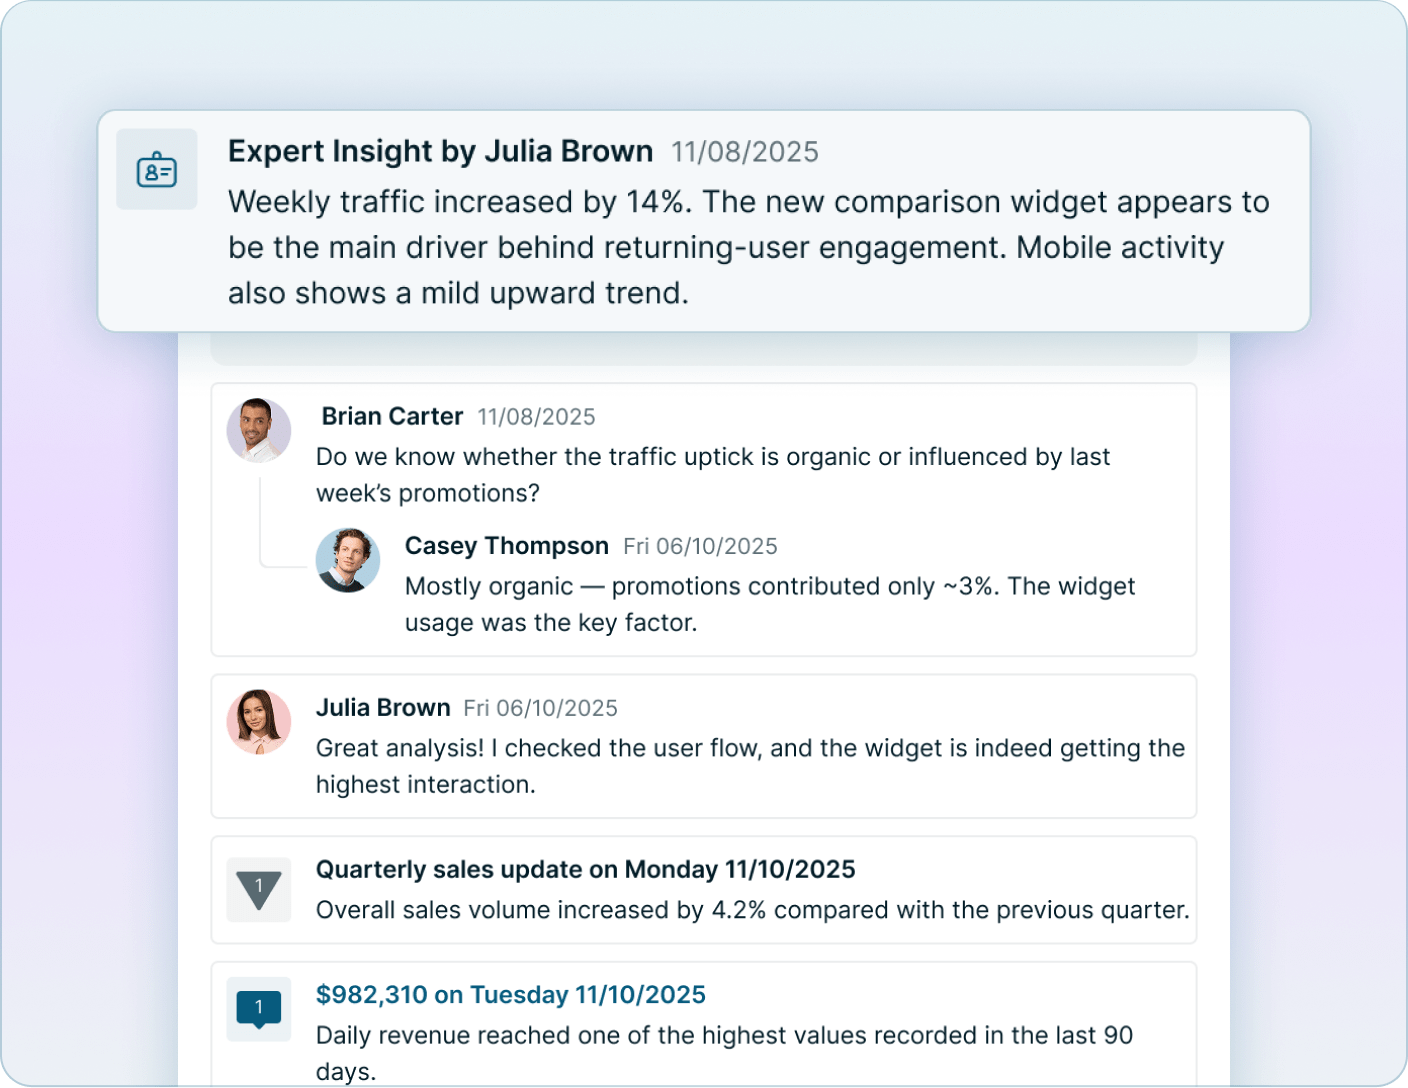
Collaboration
Collaboration features give a consistent way for users to add notes and commentary to a particular report. This includes Expert Commentary from analysts or the report owner and user-generated collaboration. Subscribe to threads or follow users to stay up-to-date on the conversation.
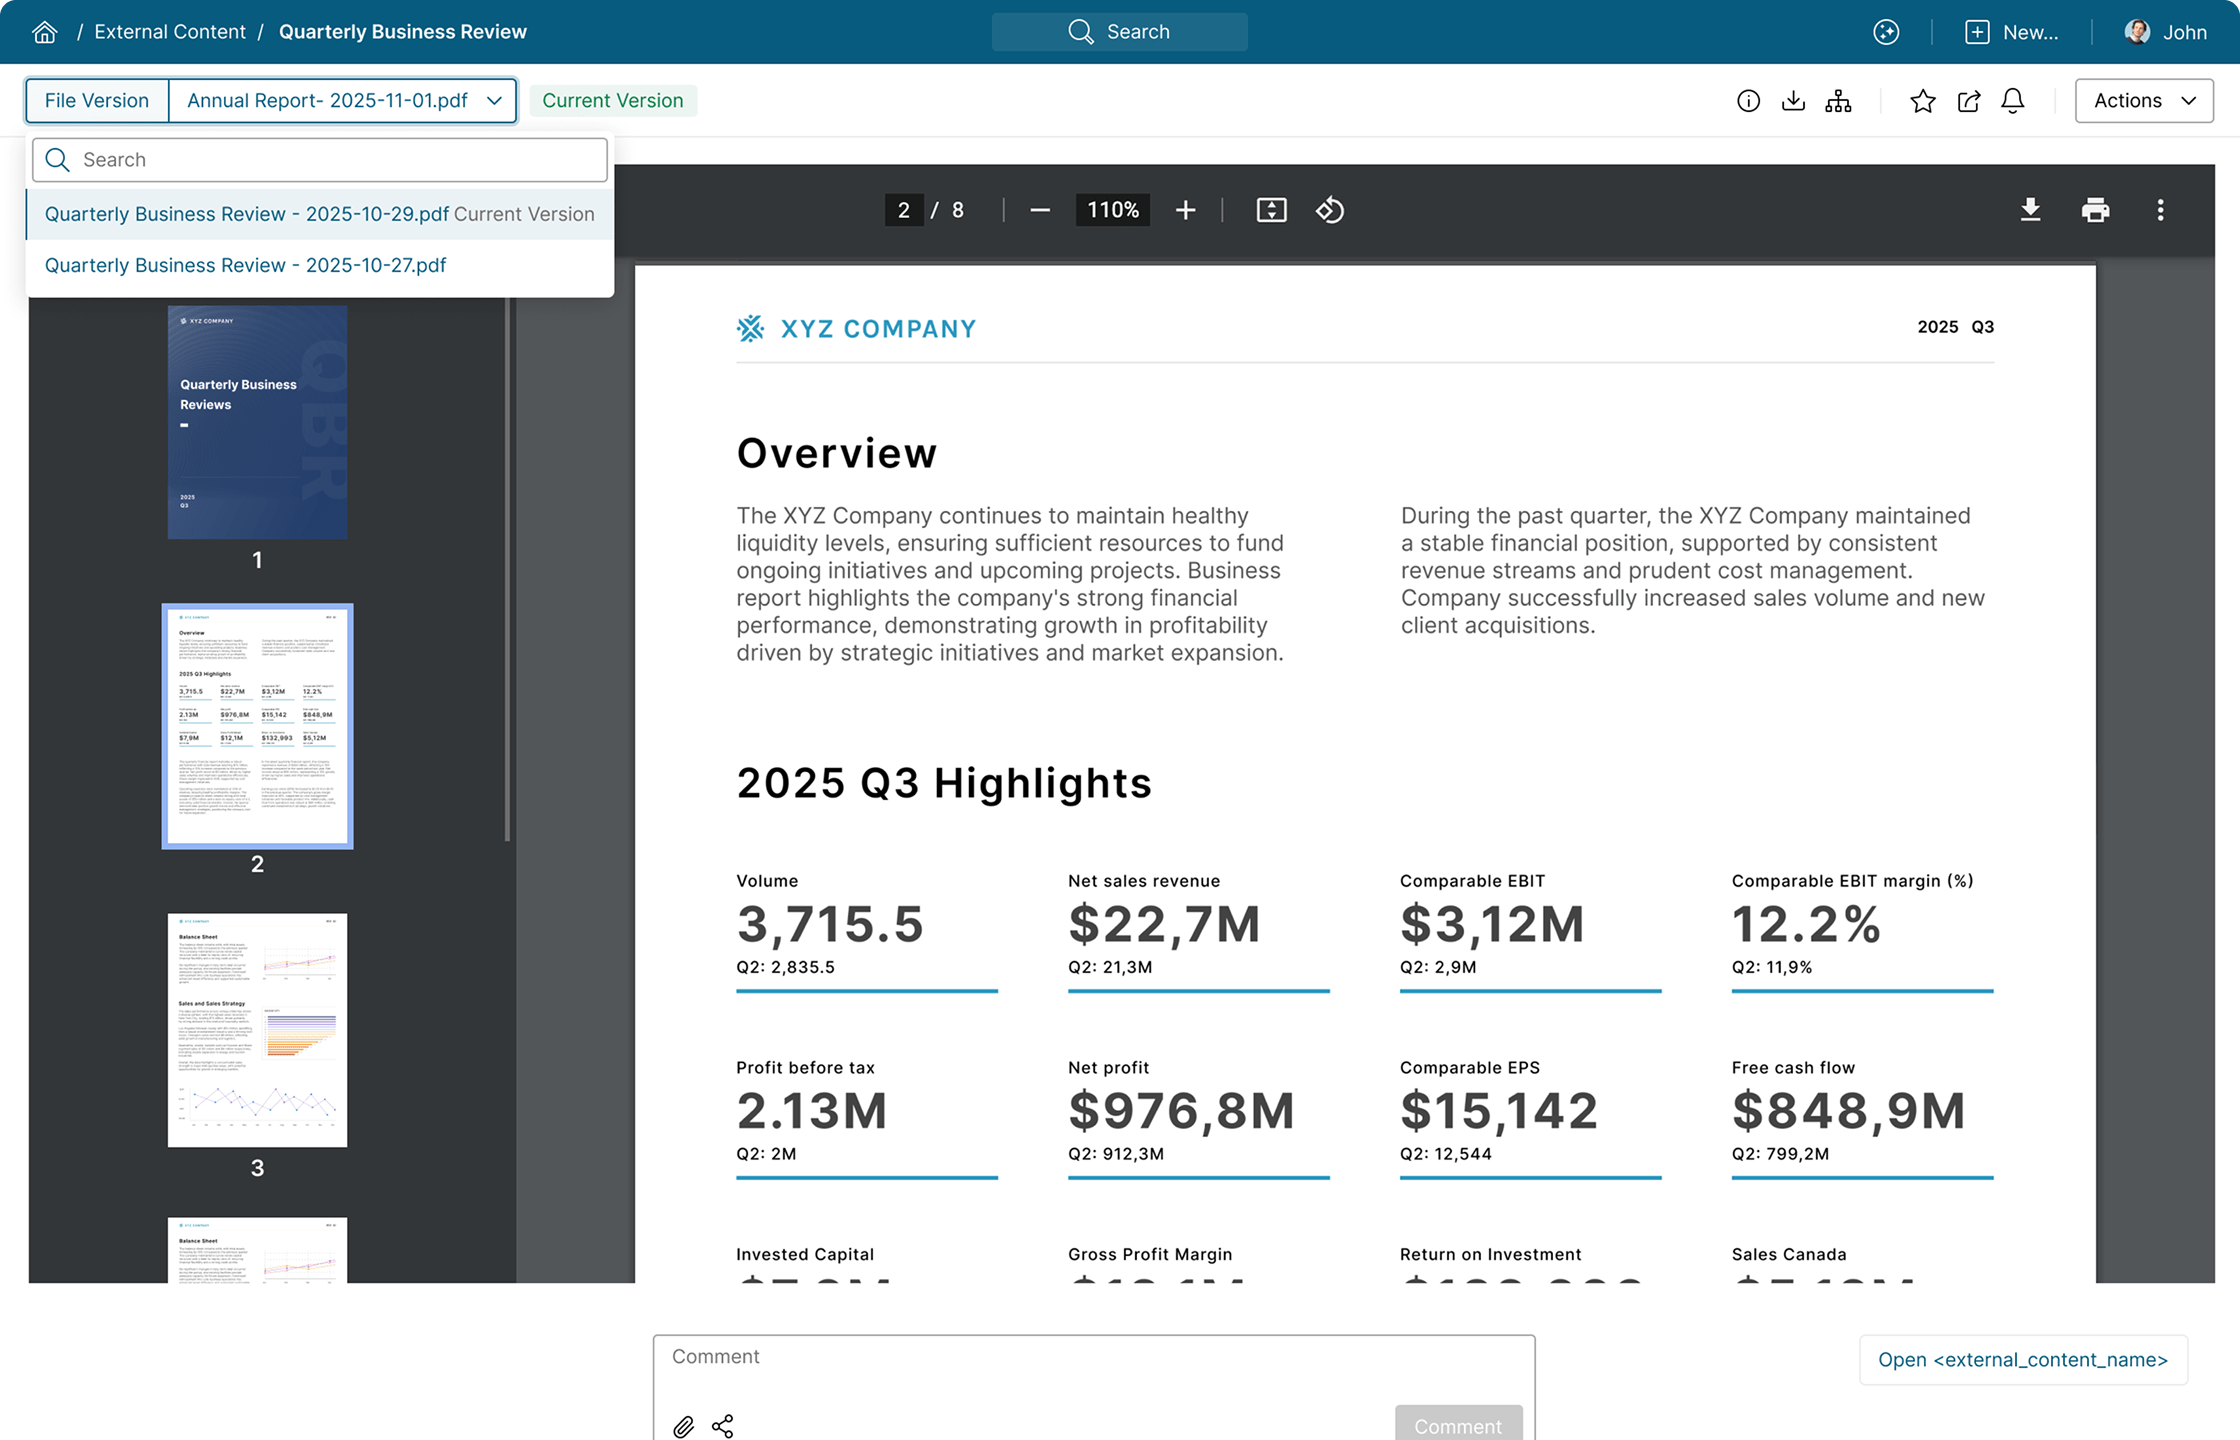
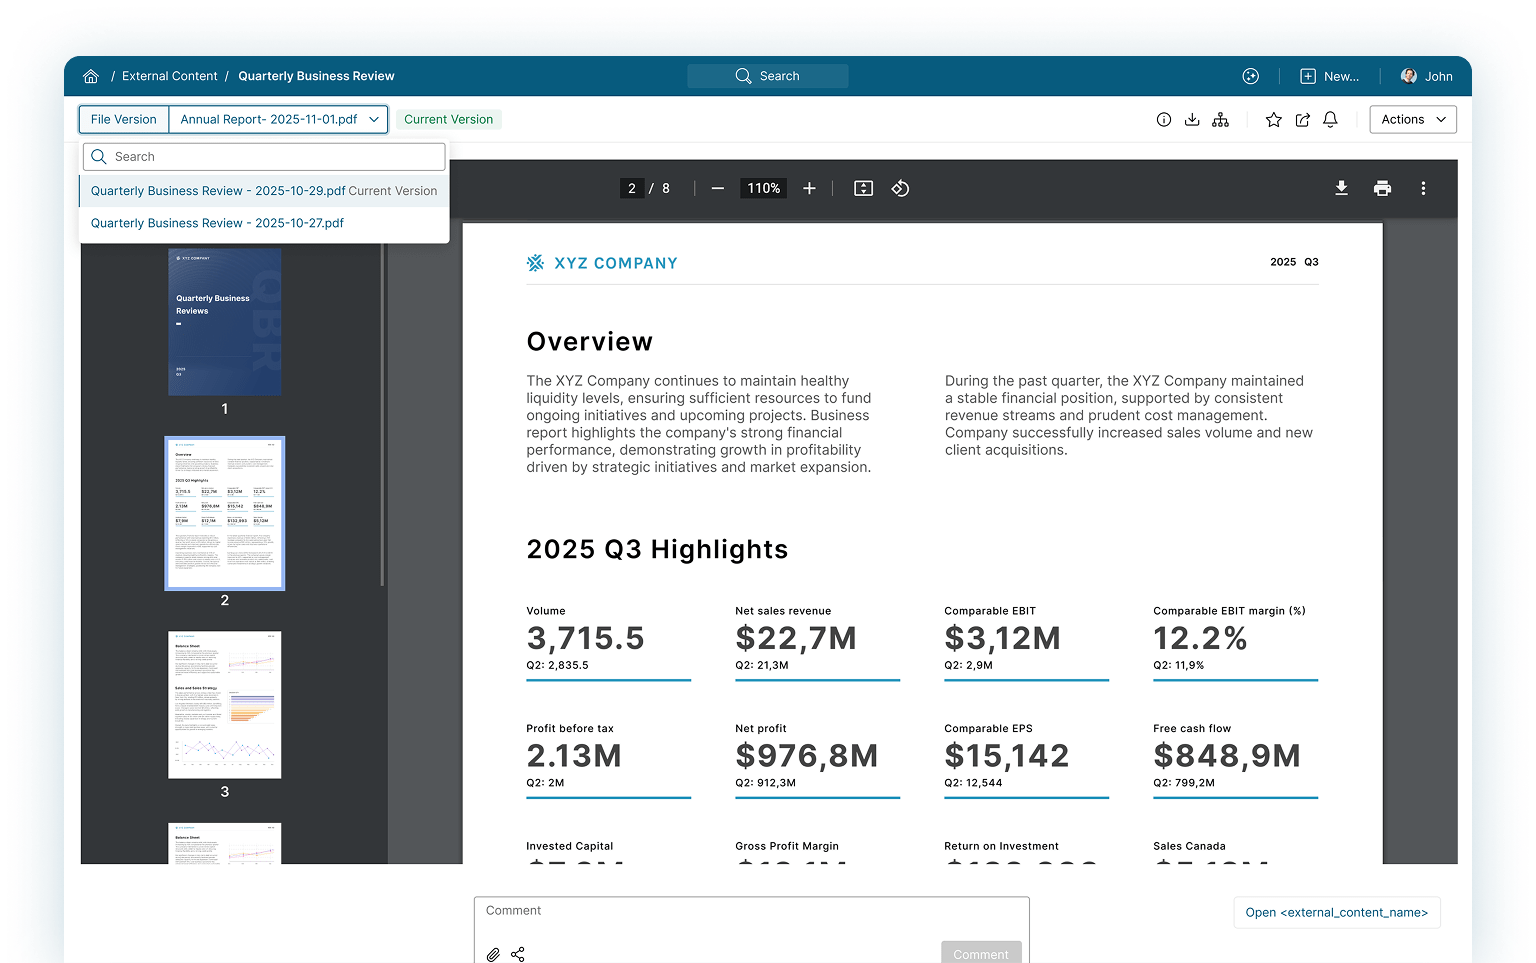
External Content
Metric Insights External Content tiles are objects within the Metric Insights Catalog that either link to URL-based content or documents stored in on-premise or cloud file stores. Users can access this type of content seamlessly alongside their BI reports.
Support Sources & Document Types
The supported sources for external content in Metric Insights include Local Filesystems or cloud based files stores such as Microsoft SharePoint or Dropbox. External Content can link to any type of document, including PDFs, Word Documents, Excel, and PowerPoint.
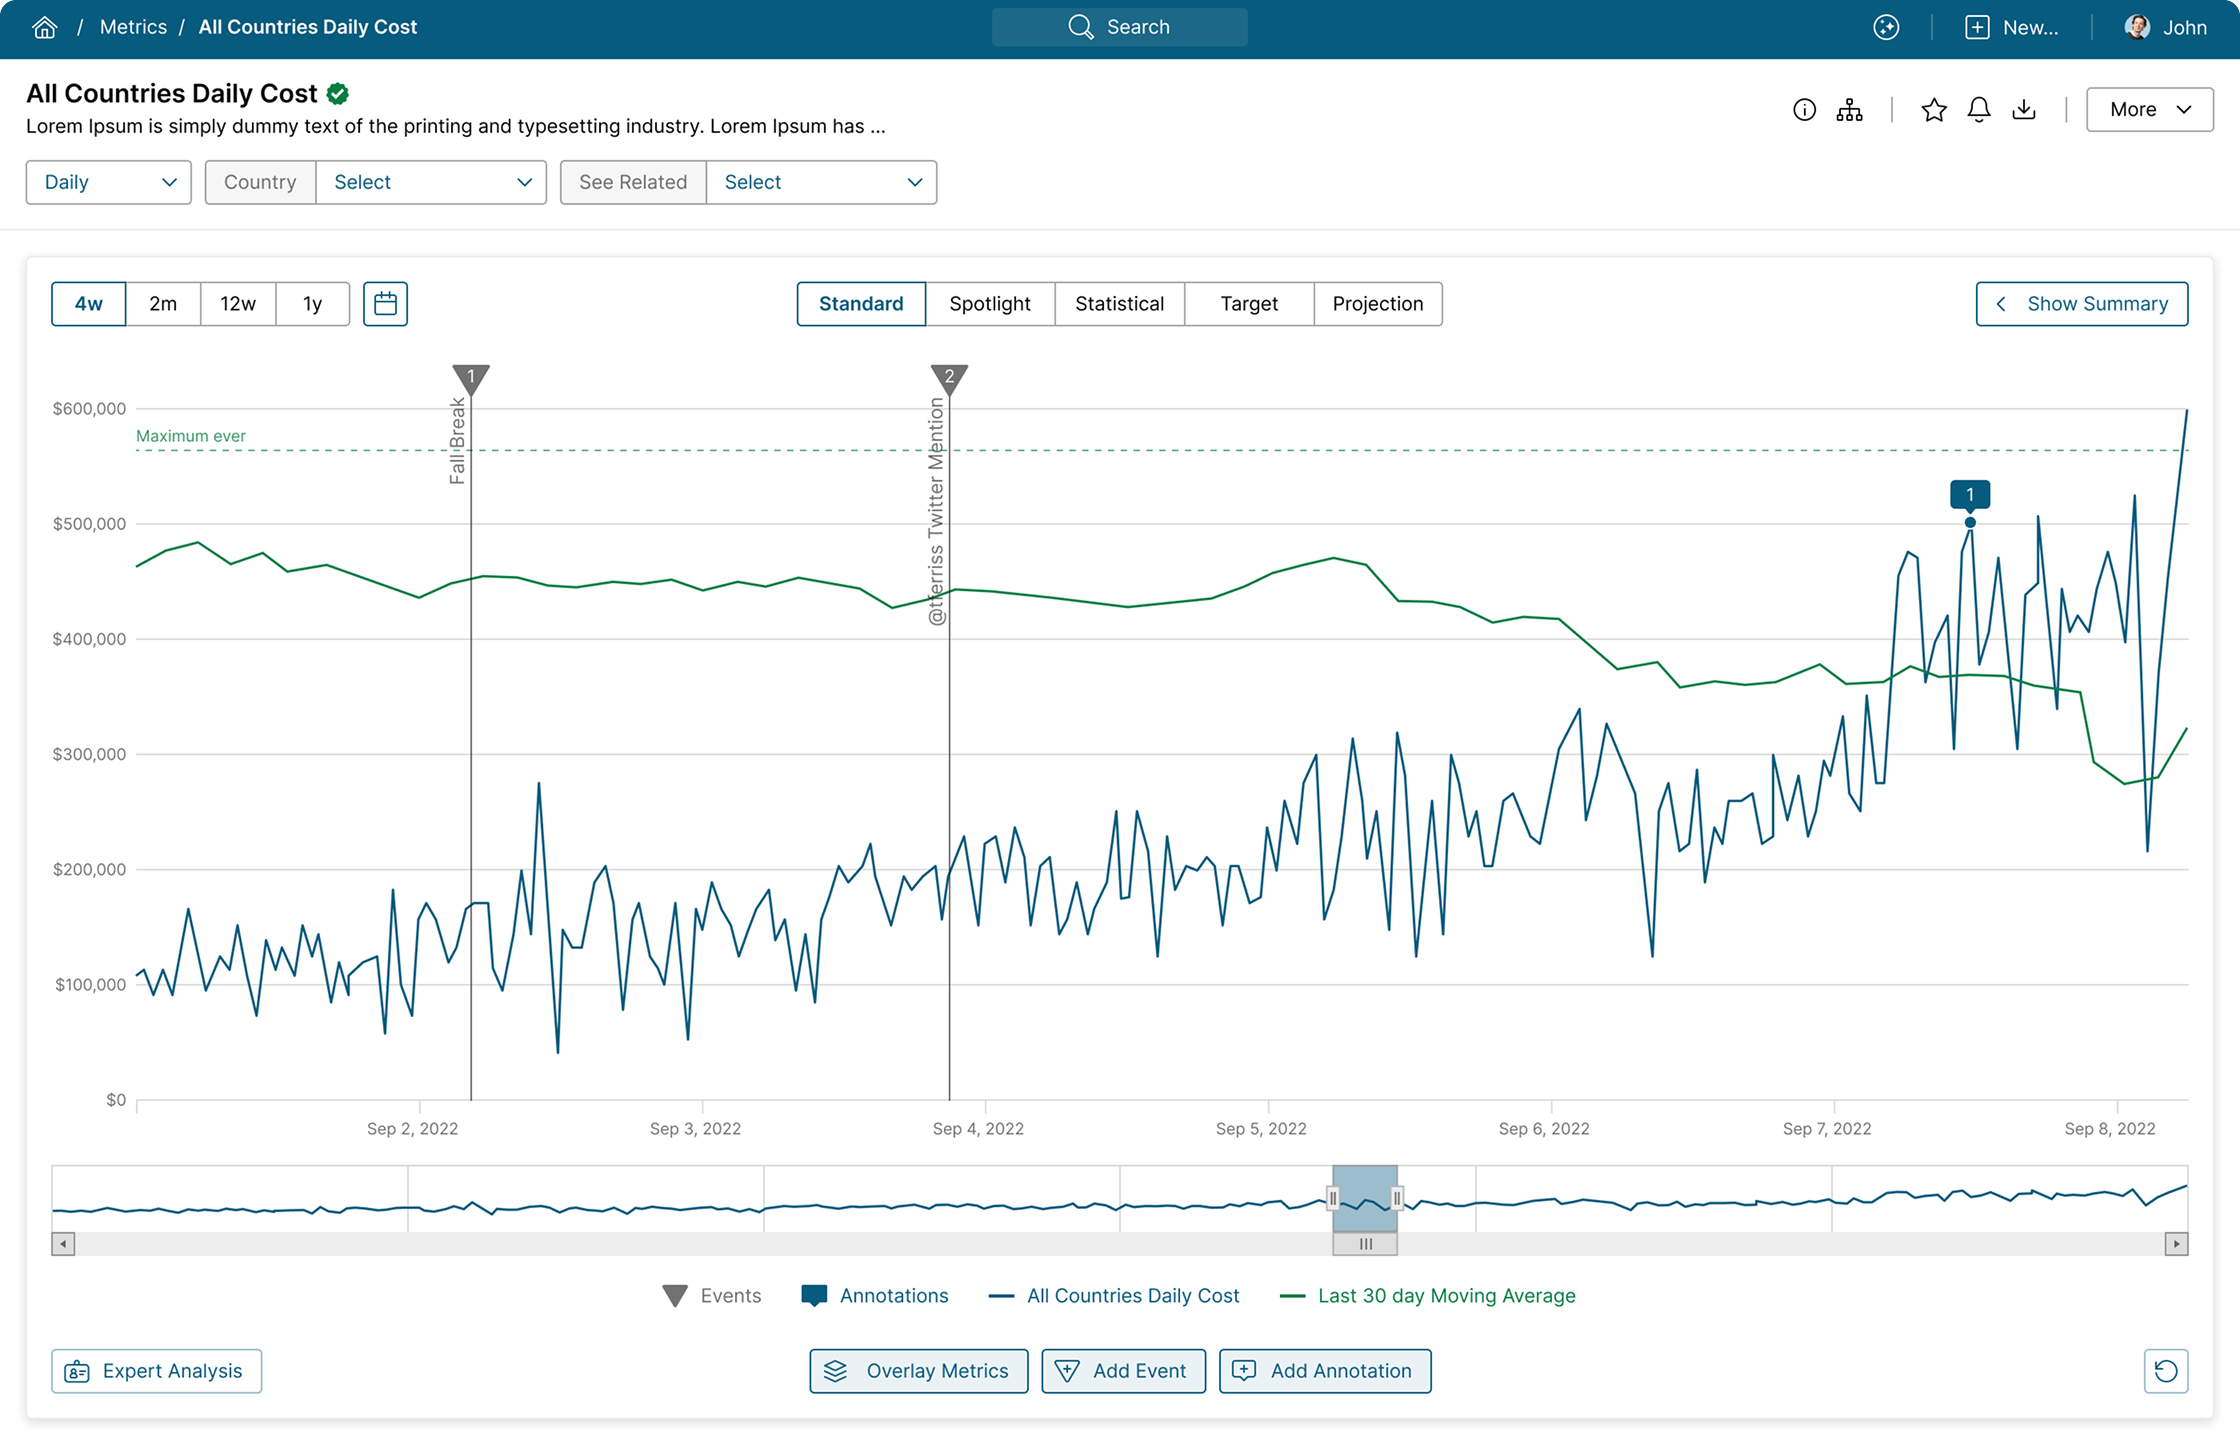
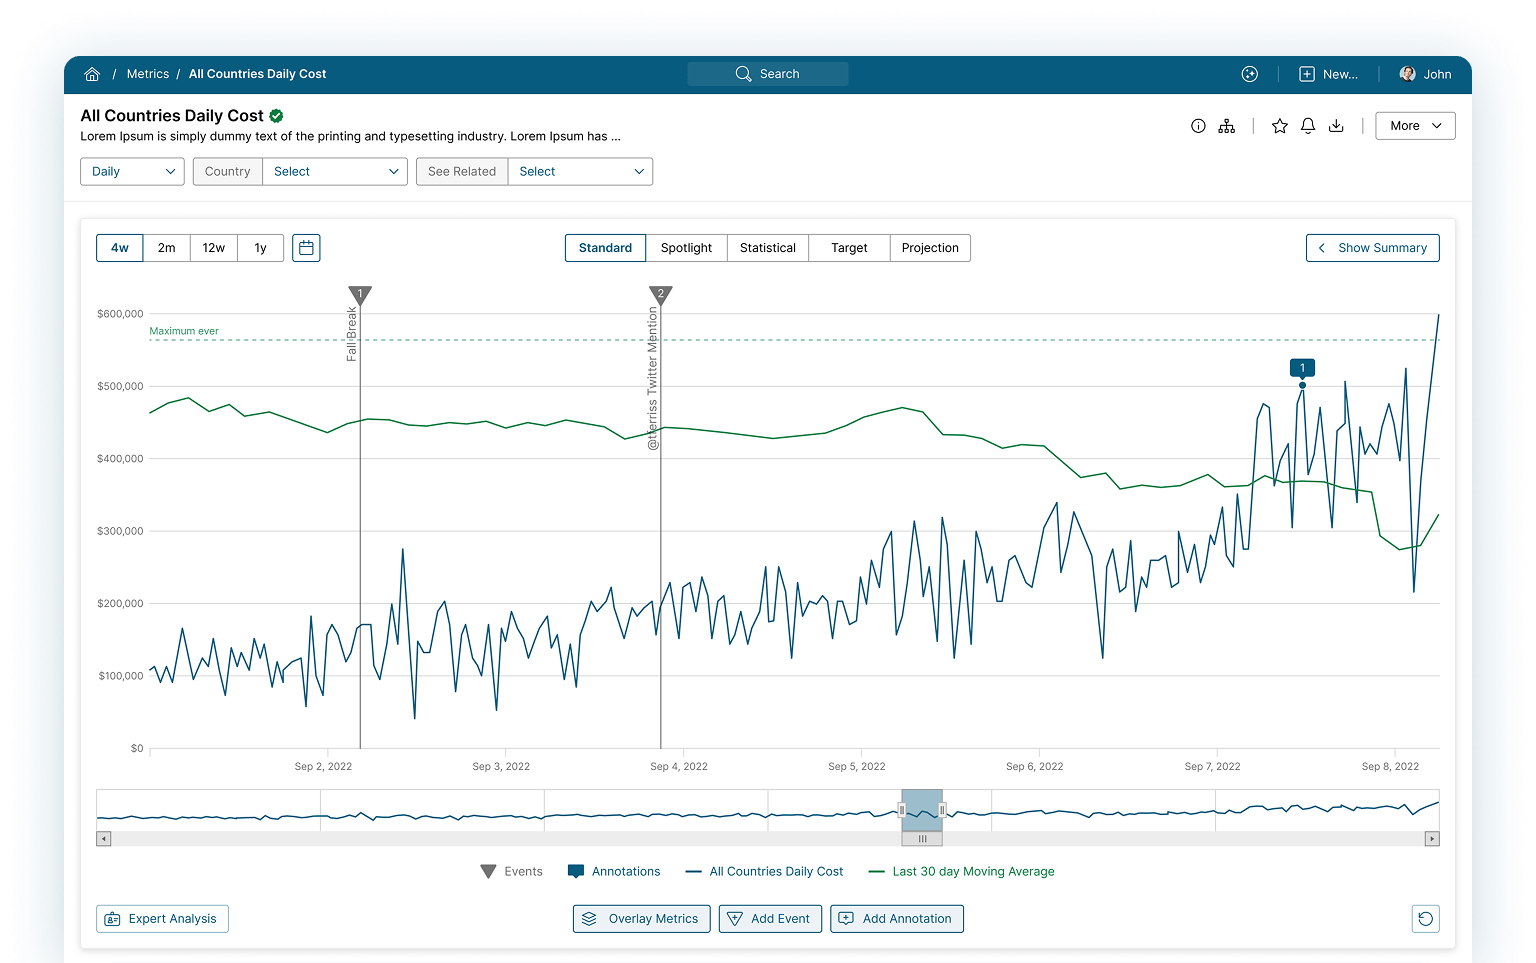
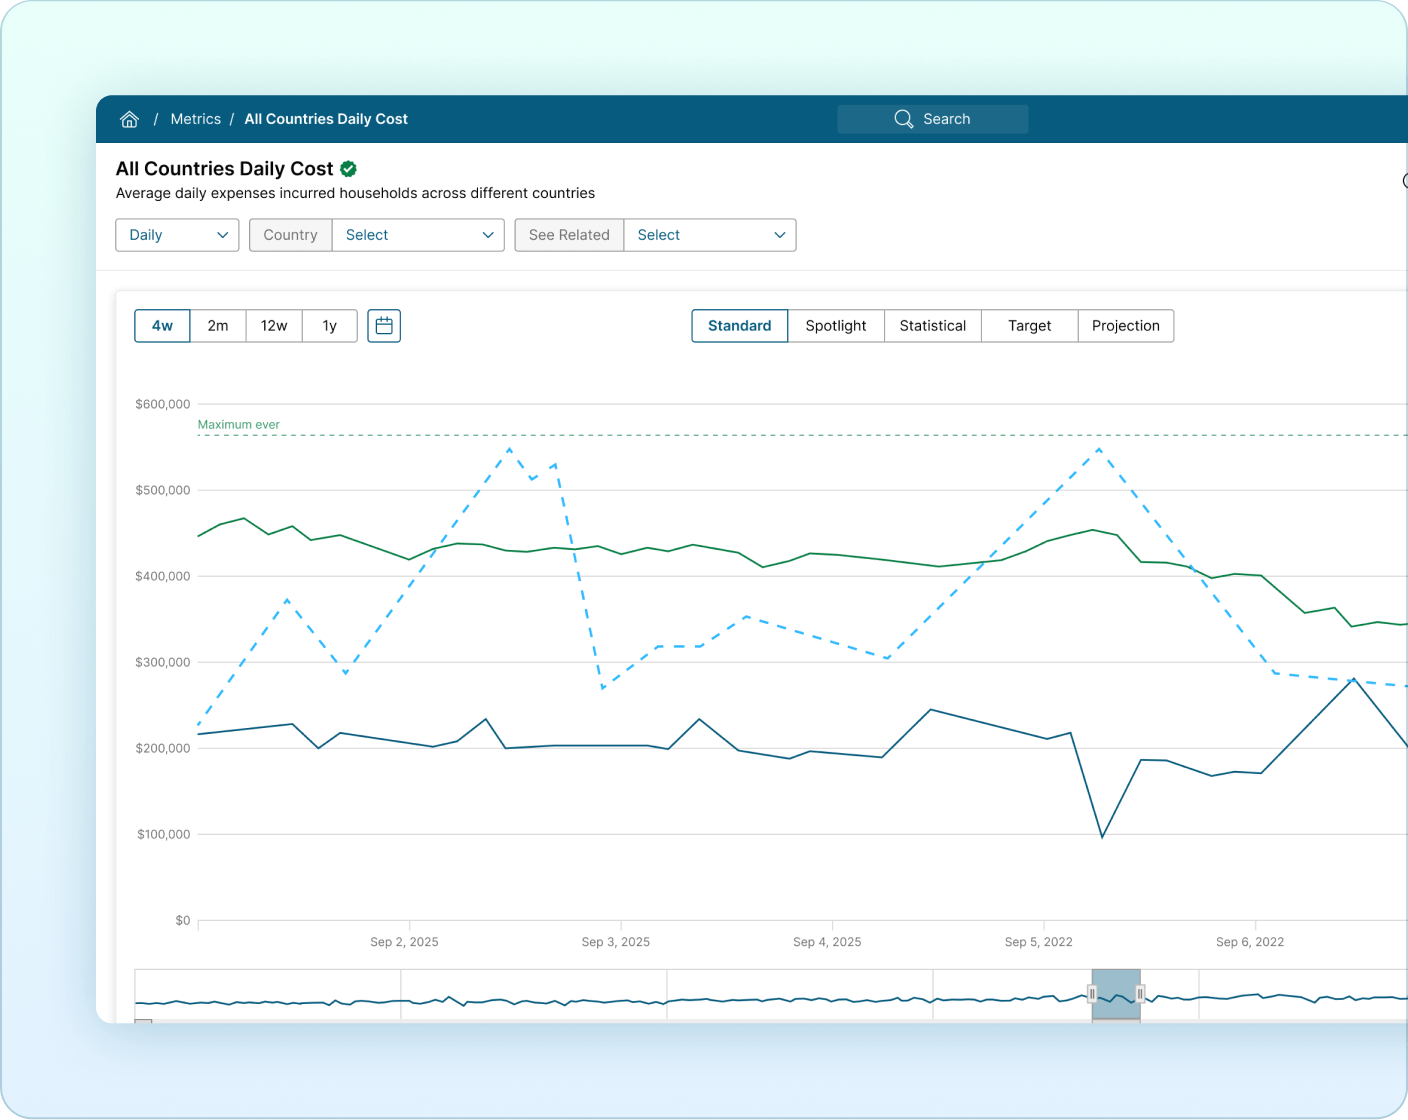
Metric Insights Metric tiles are objects within the Metric Insights Catalog that visualize time-series data. It enables easy visualization and alerting on critical key performance indicators, driving users to the reports that need their attention the most.
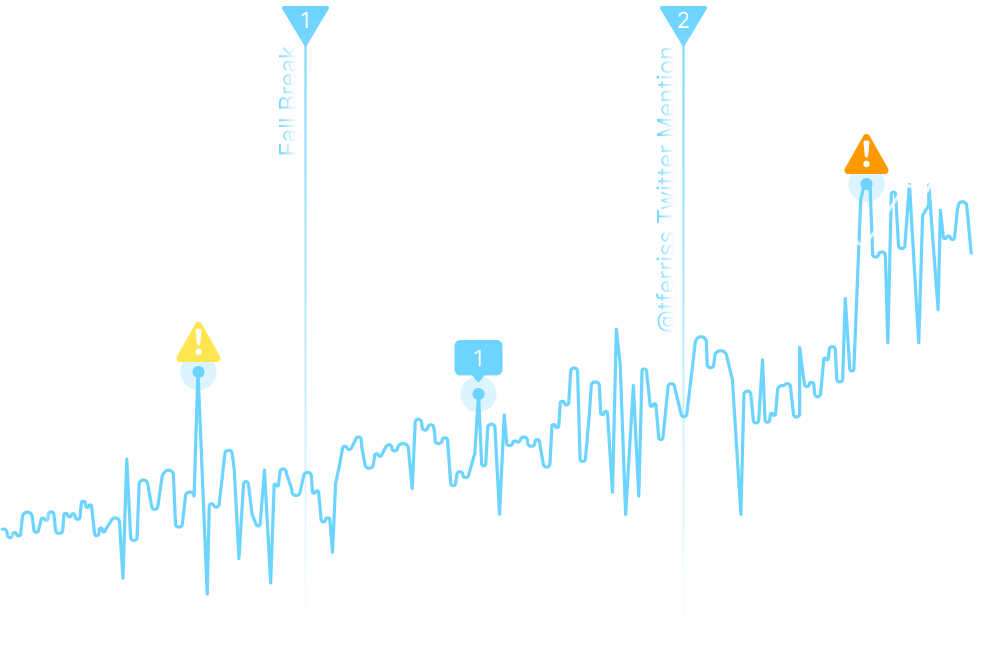
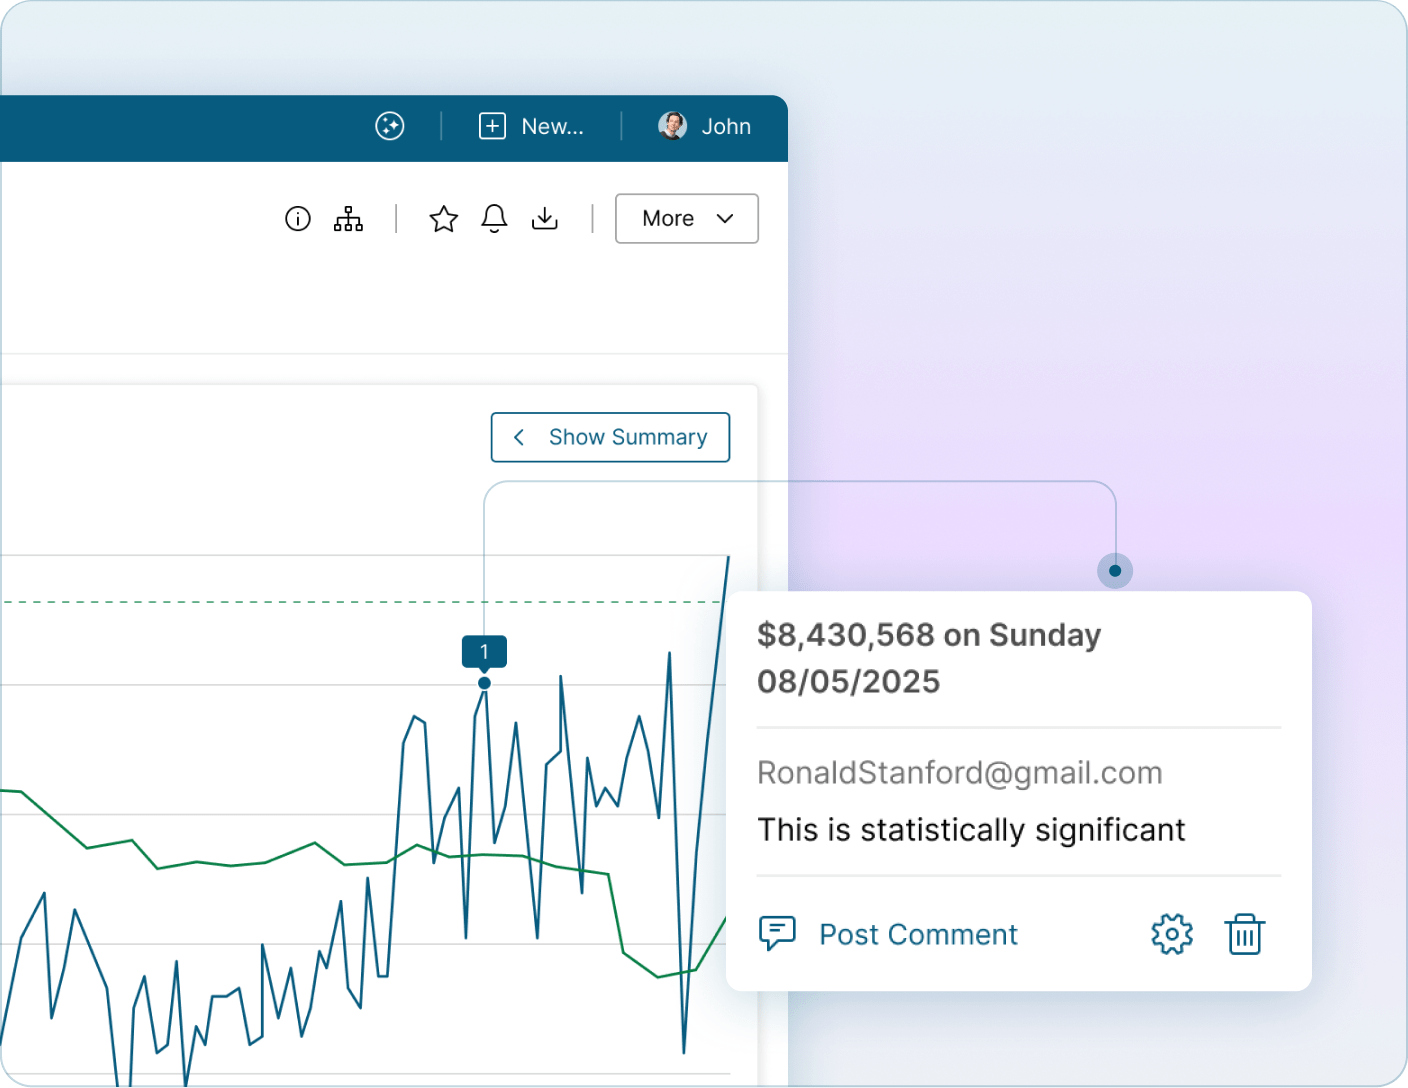
Annotations
Annotations enable users to share insights on a specific metric or time period, facilitating understanding and discussion around the data.
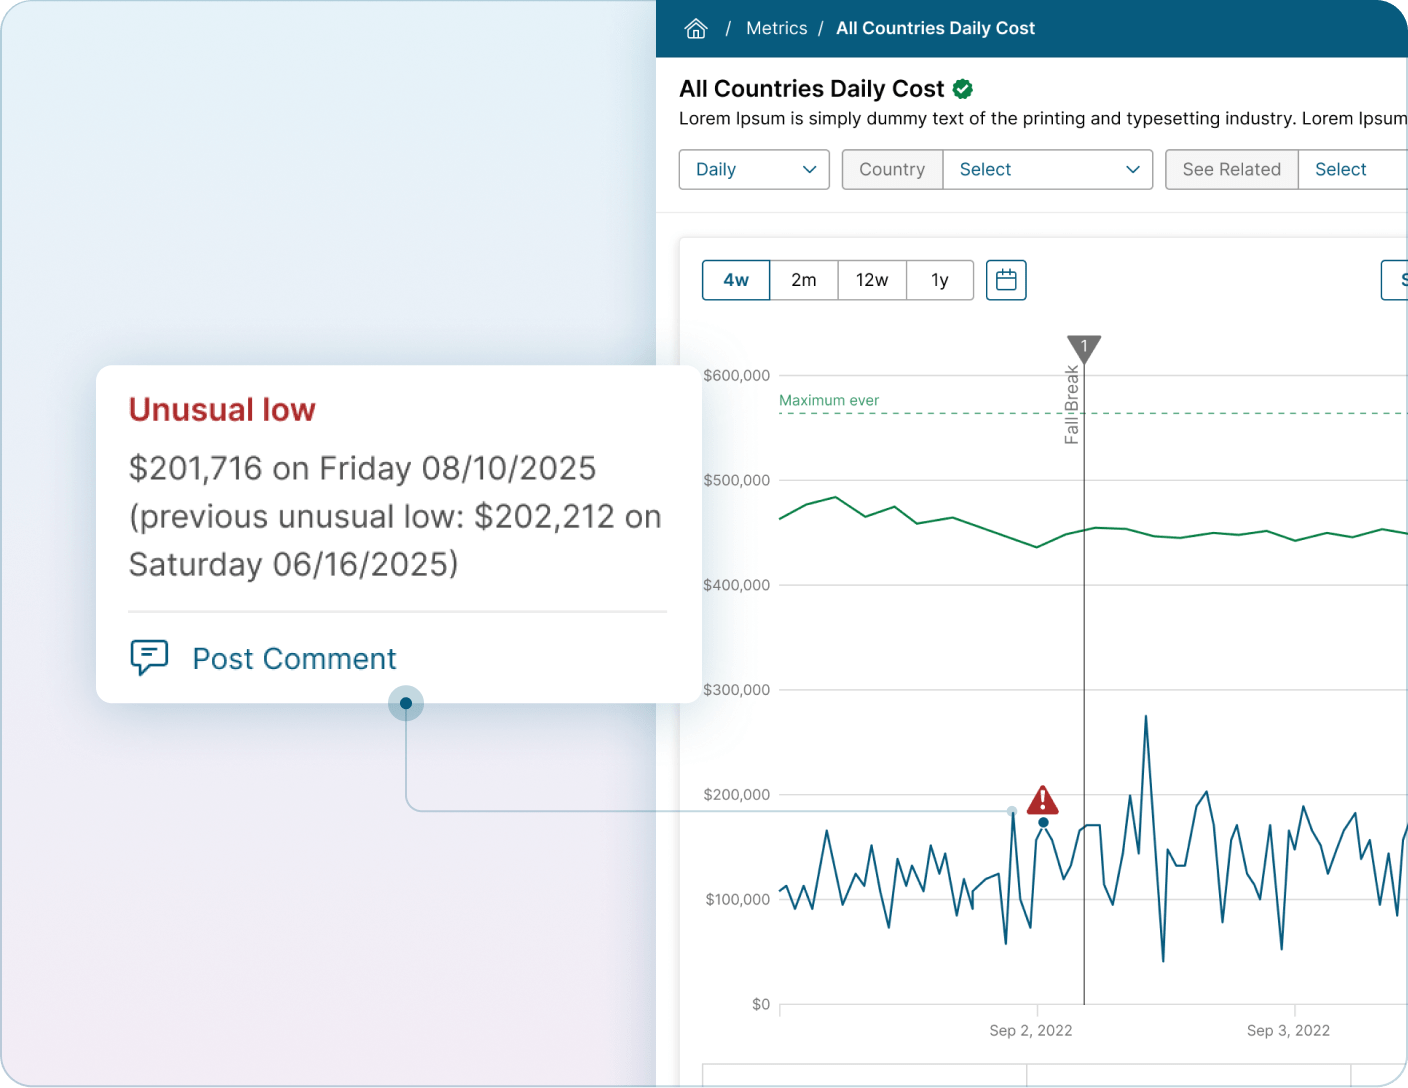
Alerting
Users can set up rule-based notifications on metrics they care about. This includes tracking performance against targets, identifying statistical outliers, or comparing performance against previous results. Receive notifications in email or on a mobile device.
Overlays
Overlays allow you to compare multiple metrics, from disparate sources, to identify trends and correlations.
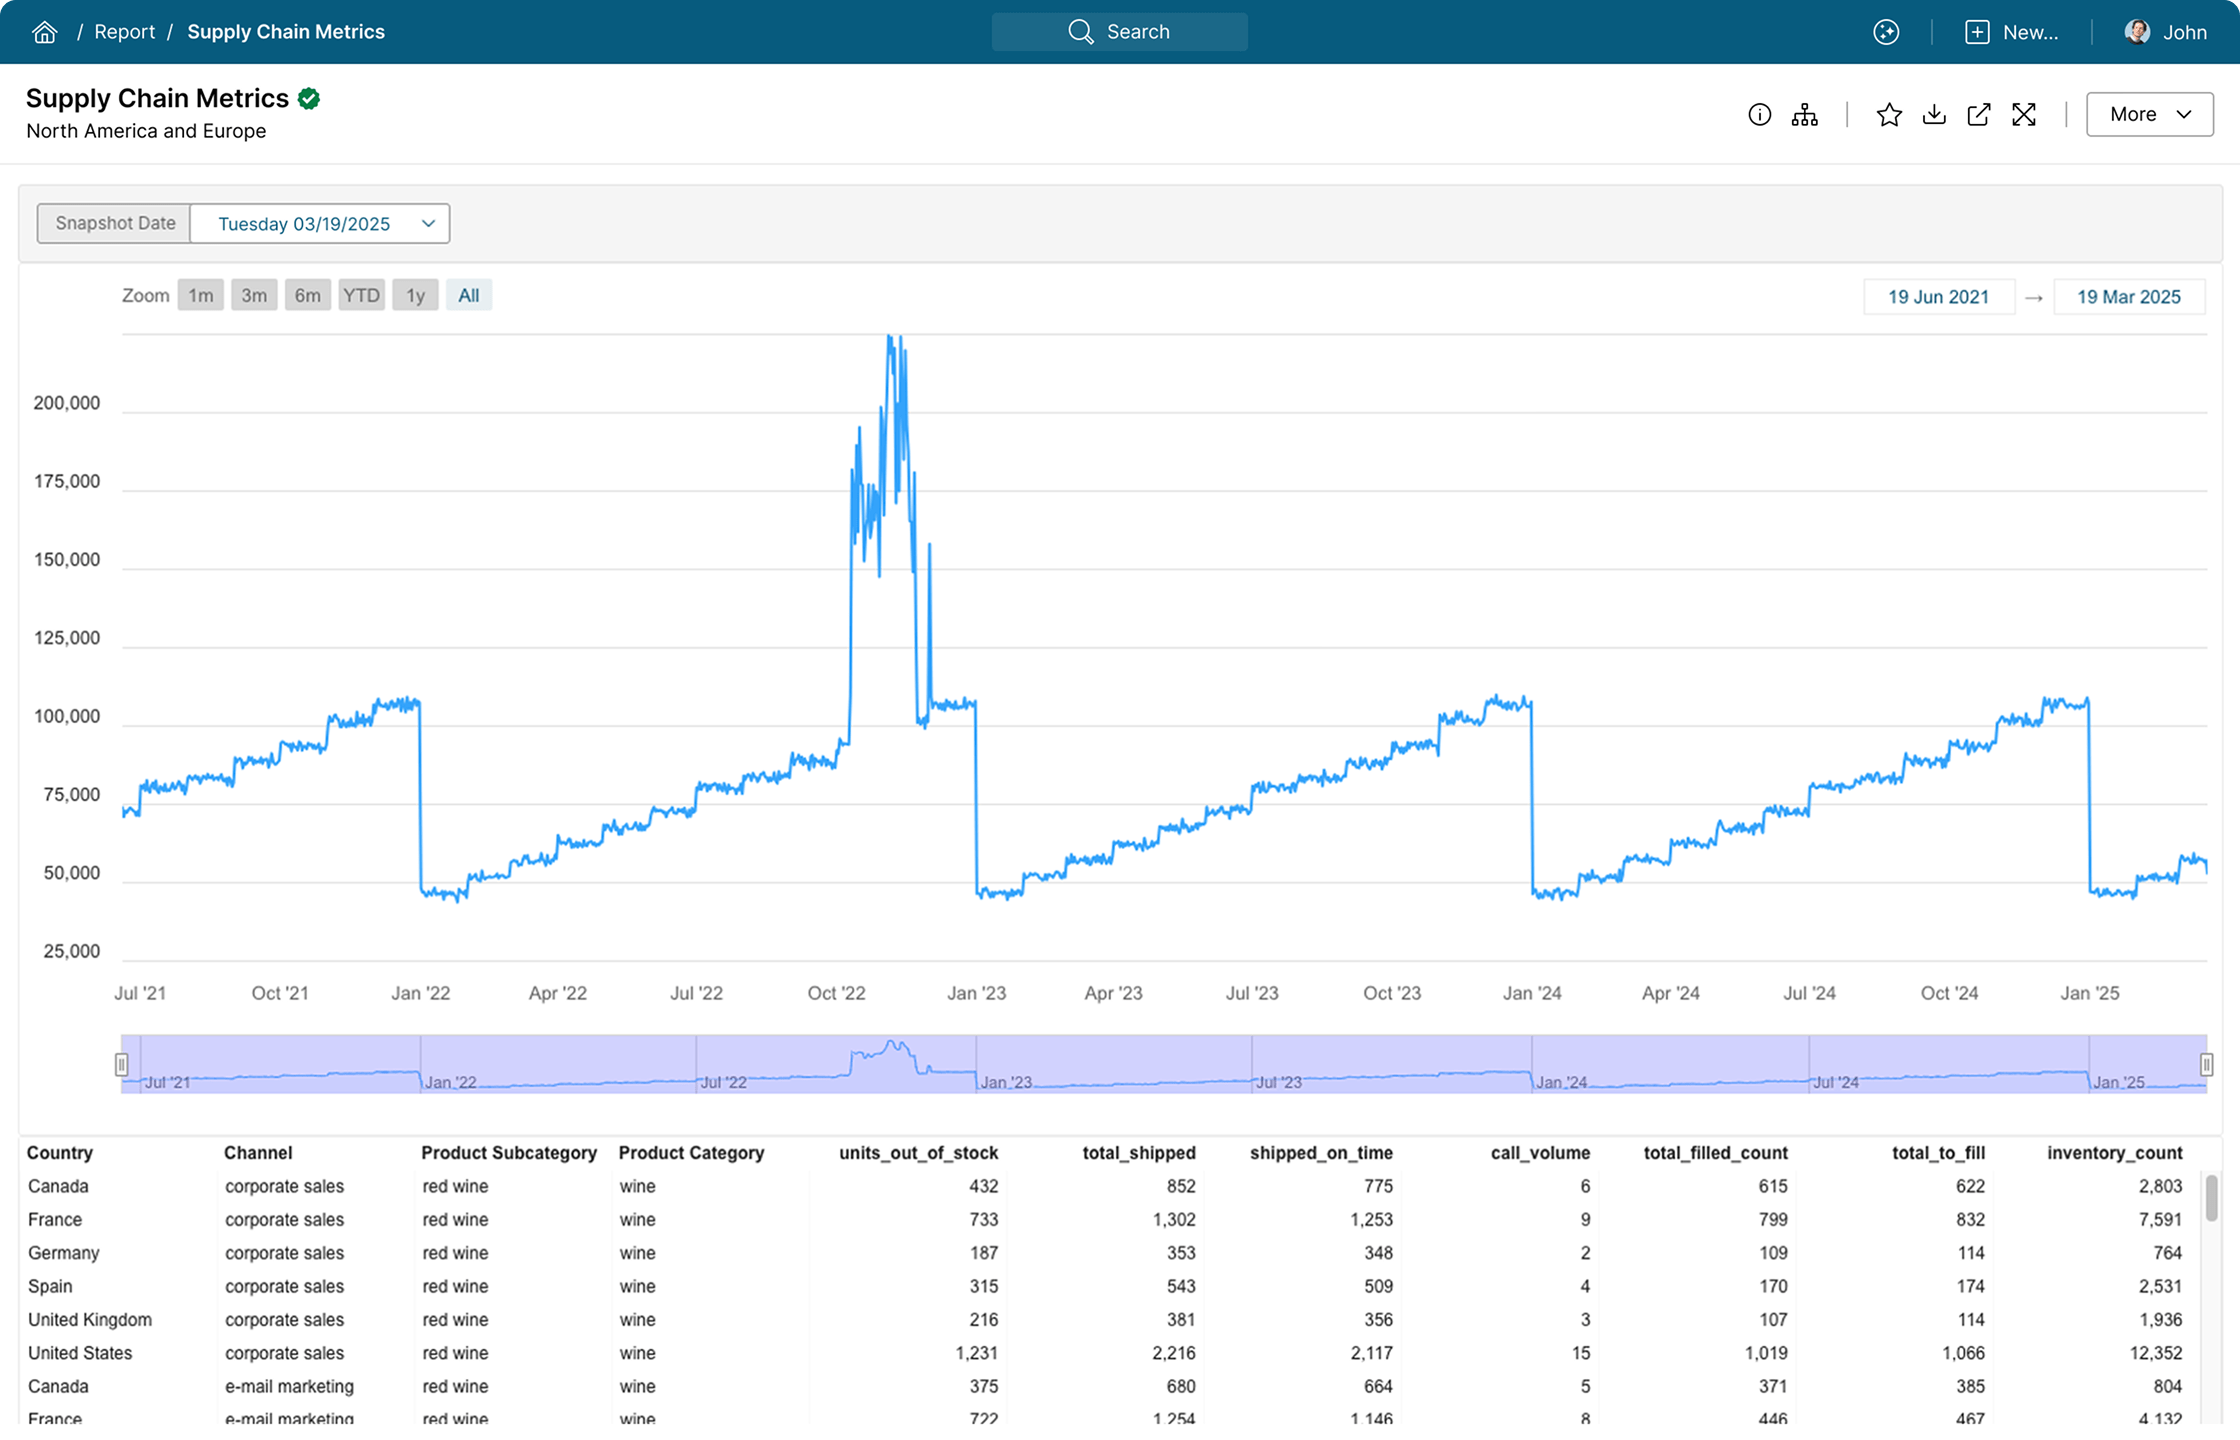
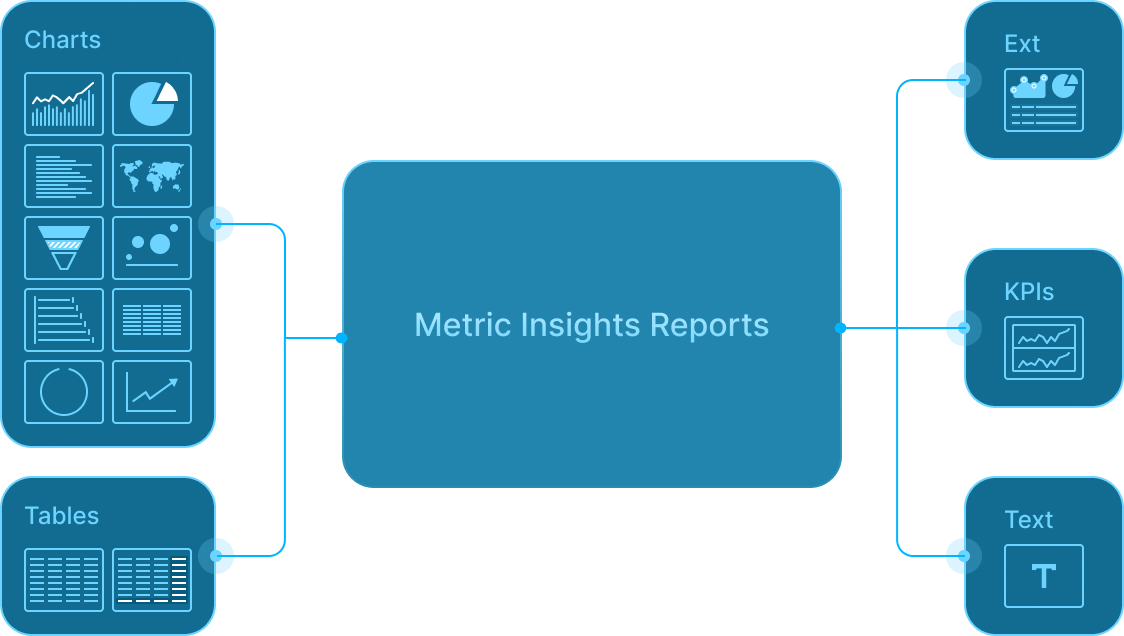
Reports
Metric Insights Report Tiles quickly visualize any data set natively within the Portal. A wide array of chart types and tables are available for Reports, including the ability to create custom JavaScript chart types of your own.
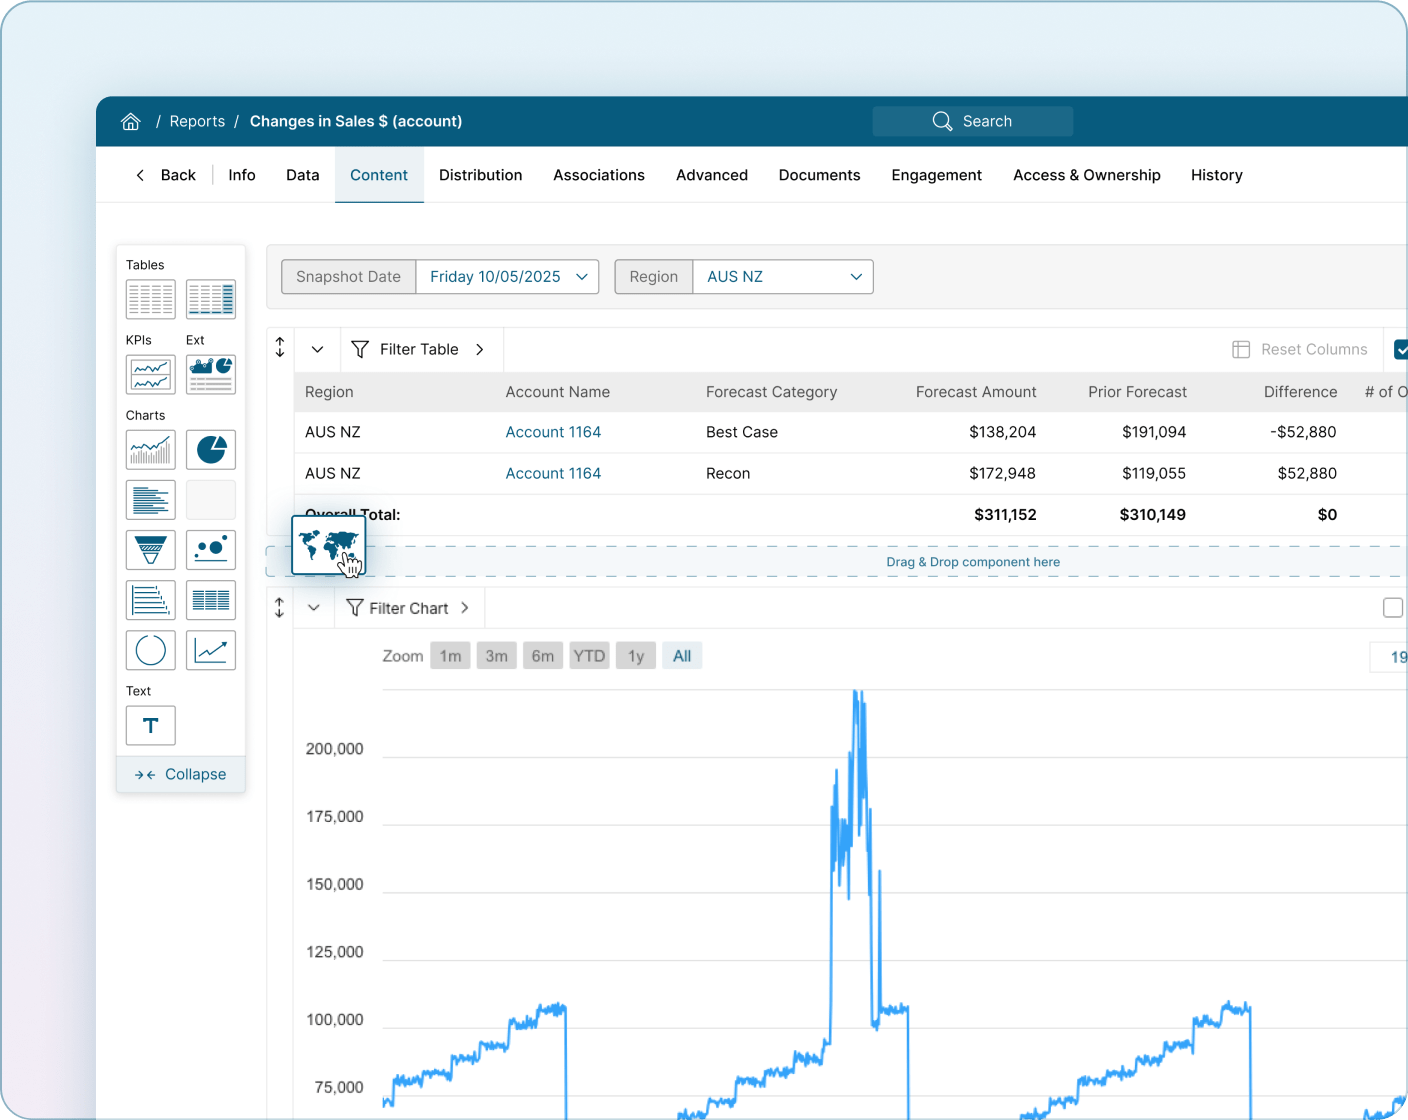
Report Designer
Create and customize reports with a simple, intuitive interface. Combine visuals, filters, and data sources to easily create reports that can be published into the Catalog.
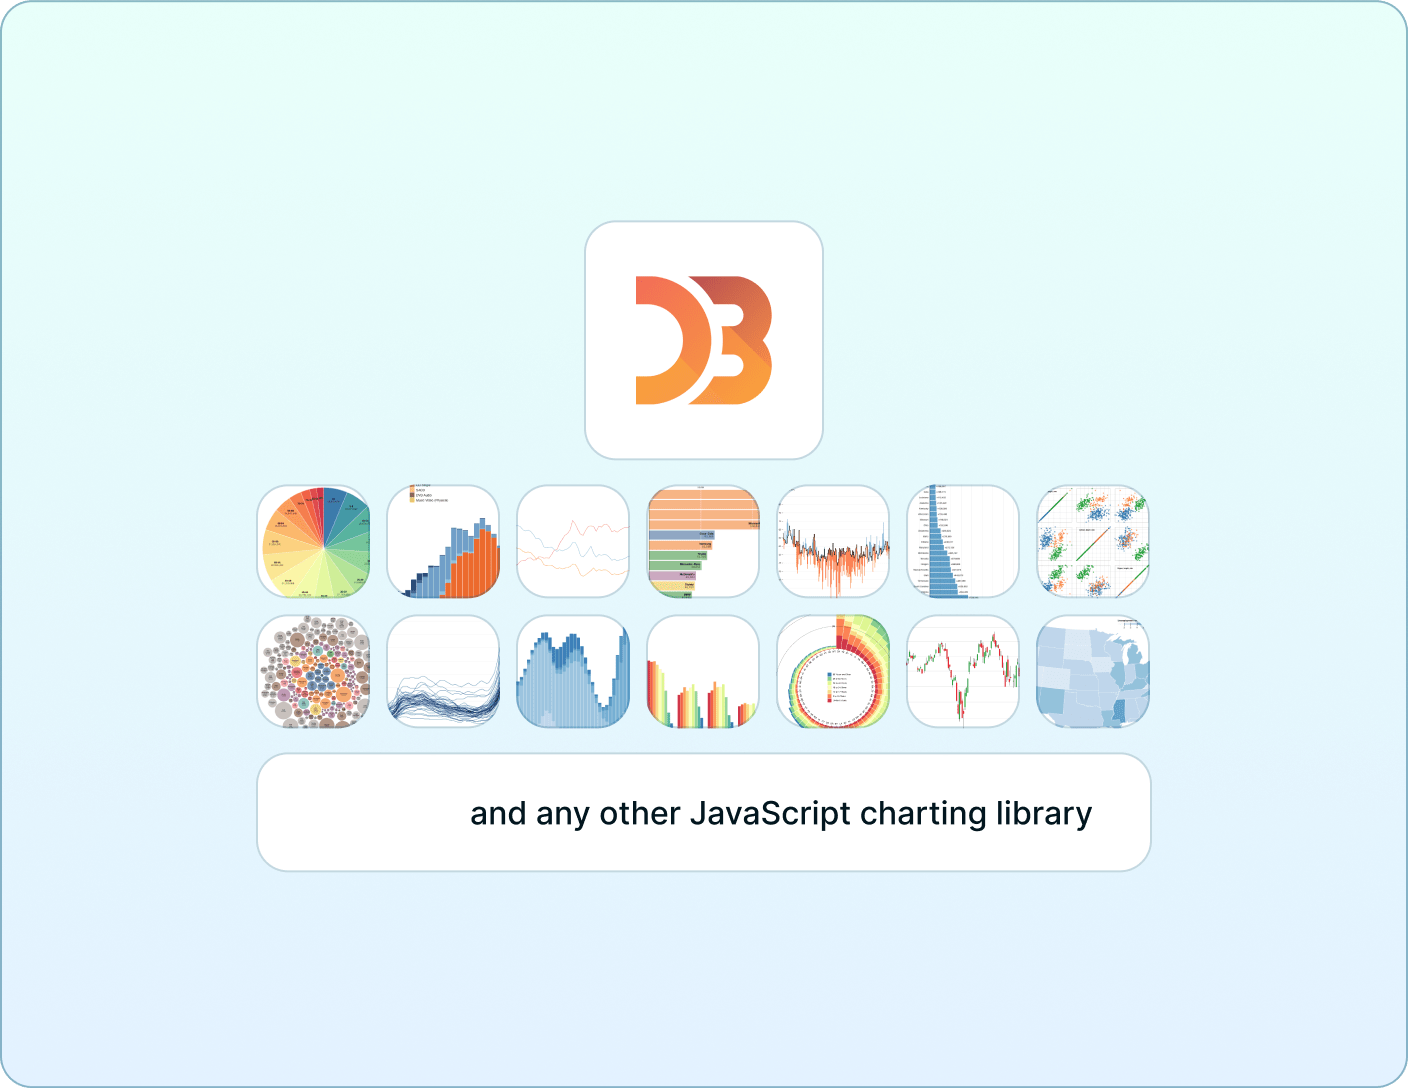
Out of the Box & Custom Chart Types
Multiple chart types are available out of the box with fully customizable options. Bring your own JavaScript charting library to the platform to create customized chart templates that can be added to the available options.
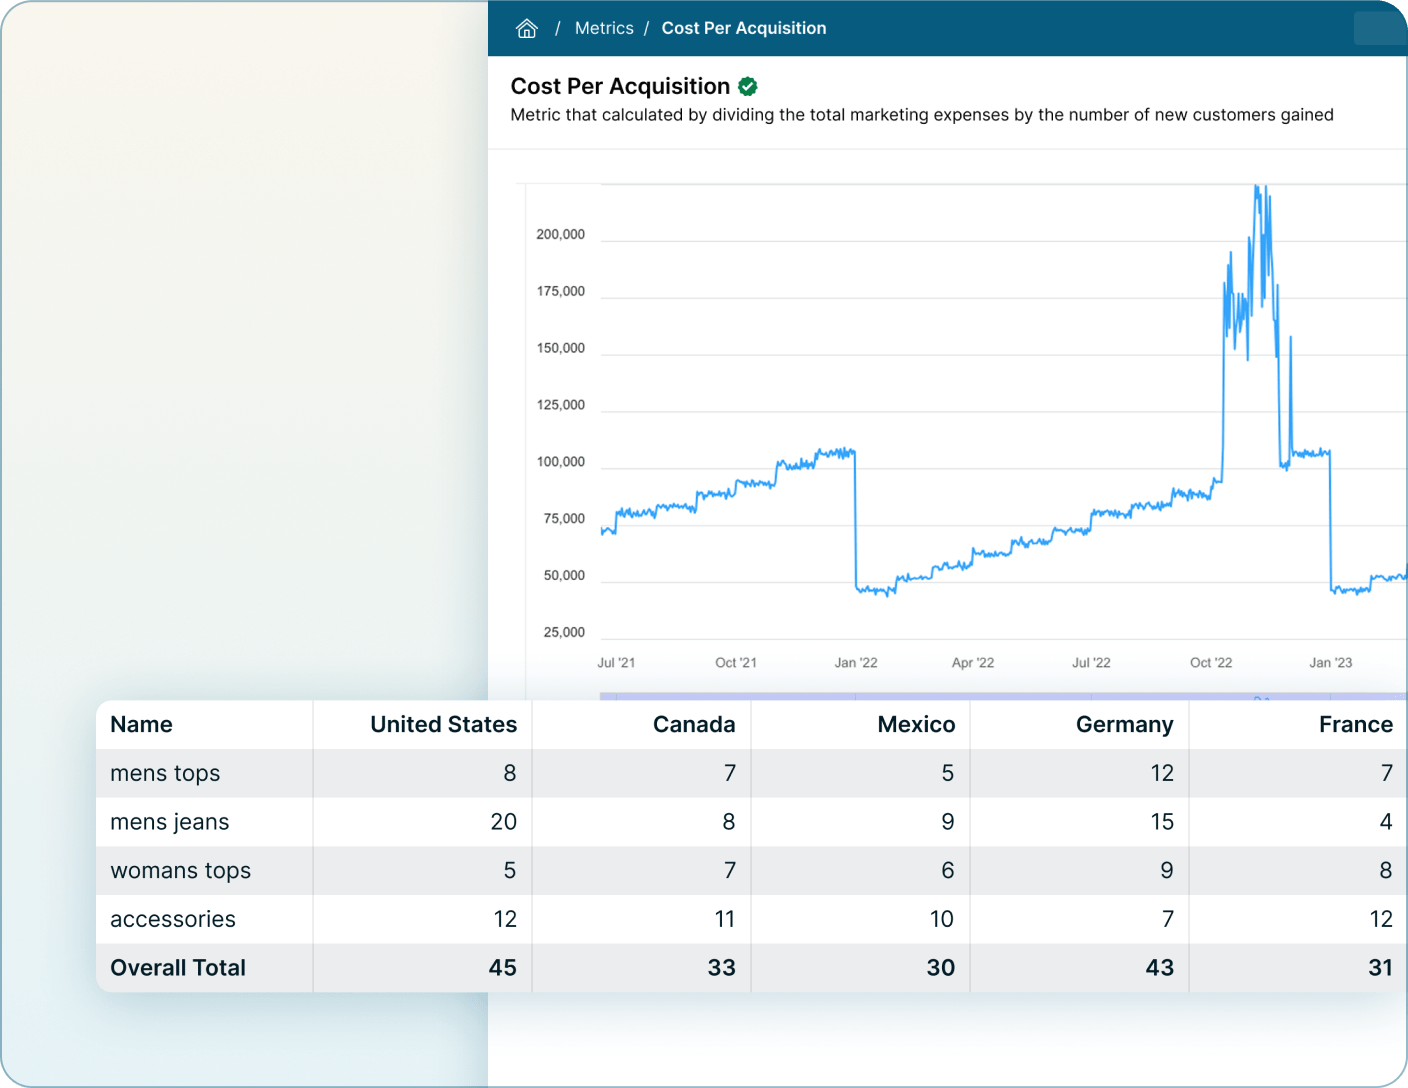
Pivot Tables
Explore your data dynamically with interactive pivot tables. Slice, filter, and aggregate metrics instantly to uncover insights.
Exception & Change Reports
Automatically snapshot datasets for reports and highlight critical exceptions in a snapshot or changes between snapshots.
Metric Insights uses cookies and similar technologies to enhance site navigation, analyze site usage, personalize content and ads, and as further described in our Privacy Policy. Click “Accept All” to enable all cookies or “Reject All” to reject cookies.