Core Platform: Concierge

Knowledge Graph

The semantic layer that teaches Concierge your business

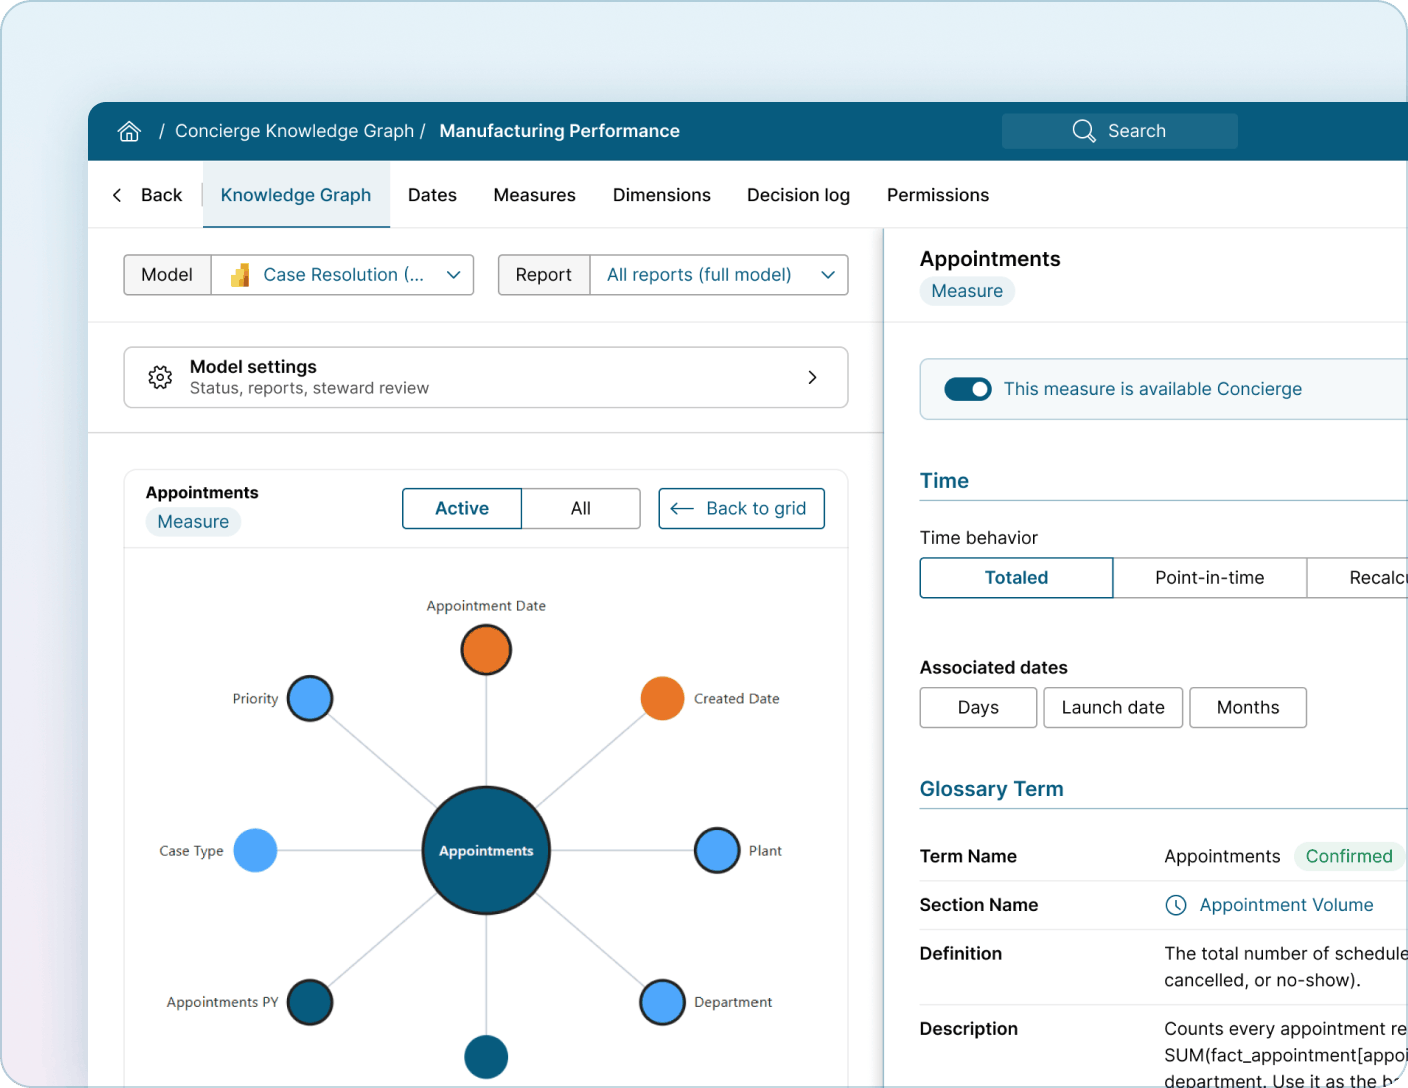
Automatic model learning

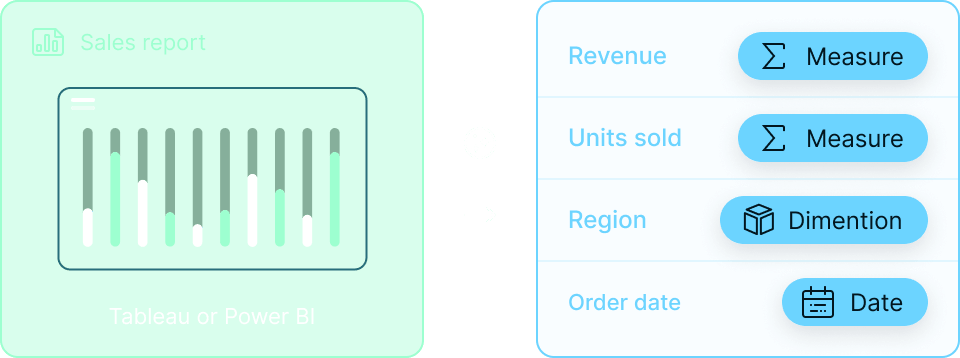
The Knowledge Graph reads the models behind your Tableau and Power BI reports and maps their measures, dimensions, dates and relationships. It learns what your reports show and use, names every field clearly, and records how each calculation is built, with no manual modeling required.
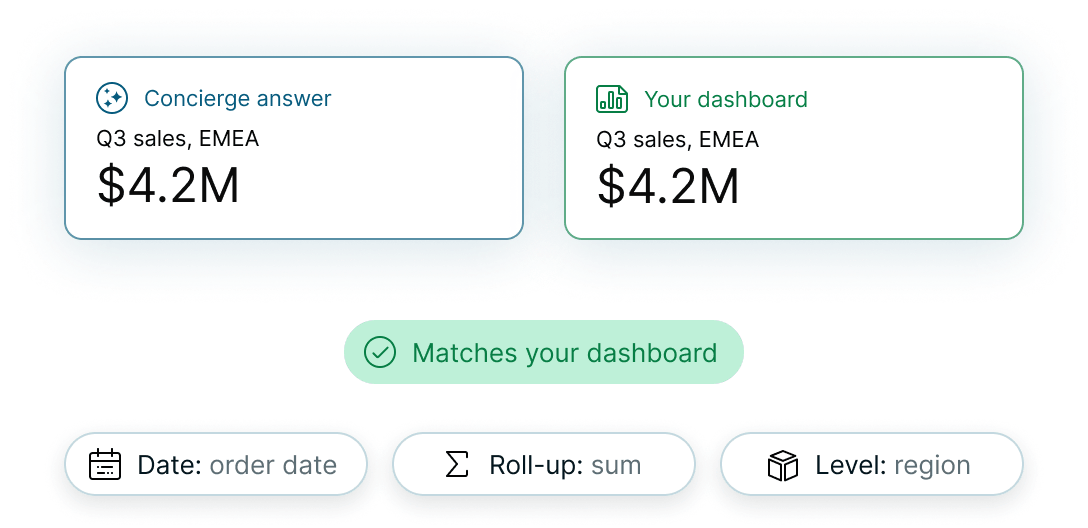
Answers you can trust

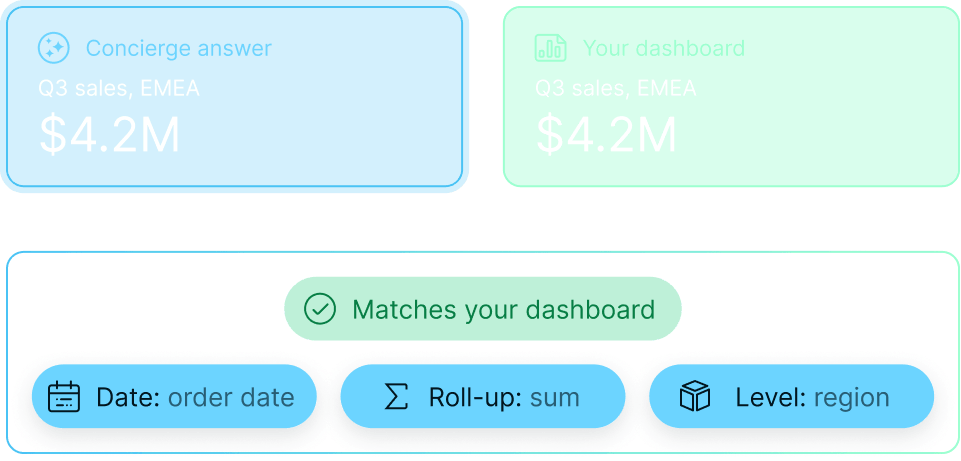
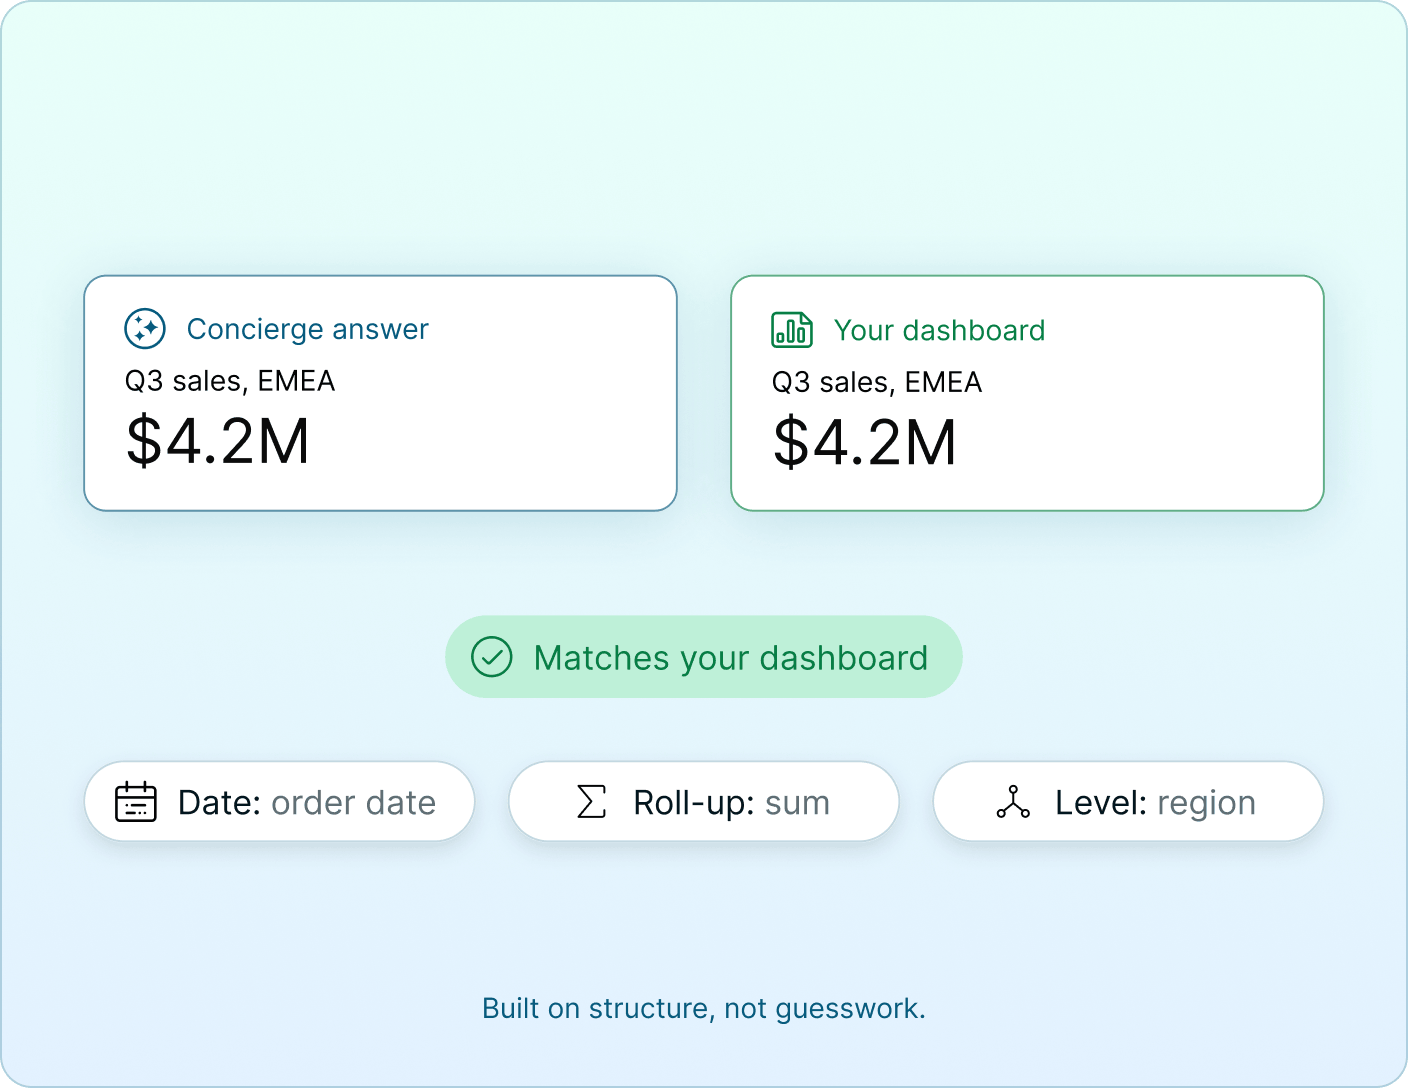
Every decision about your data is based on structural evidence, such as formulas, data types and relationships, never on field names alone. Concierge picks the right date for each measure, the right roll-up and the right level of detail, so you get the same numbers your dashboards show.
Concierge answer of $4.2M for Q3 sales in EMEA matches the dashboard, using order date, a sum roll-up, and region level.

Built on structure, not guesswork.

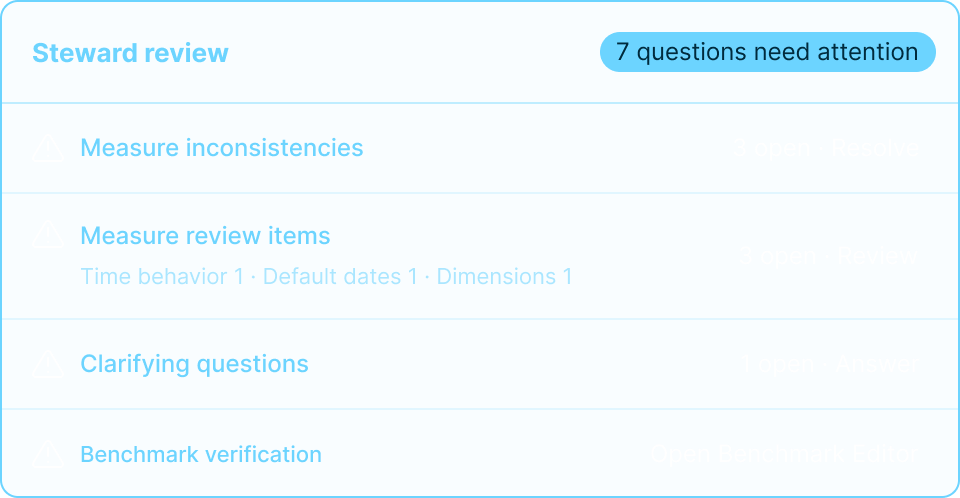
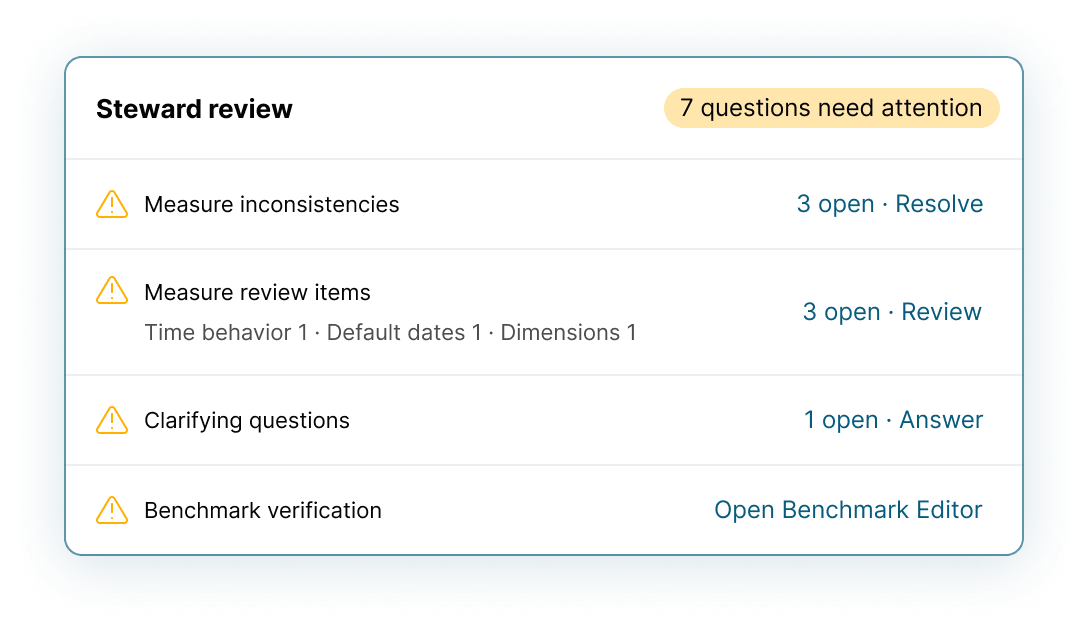
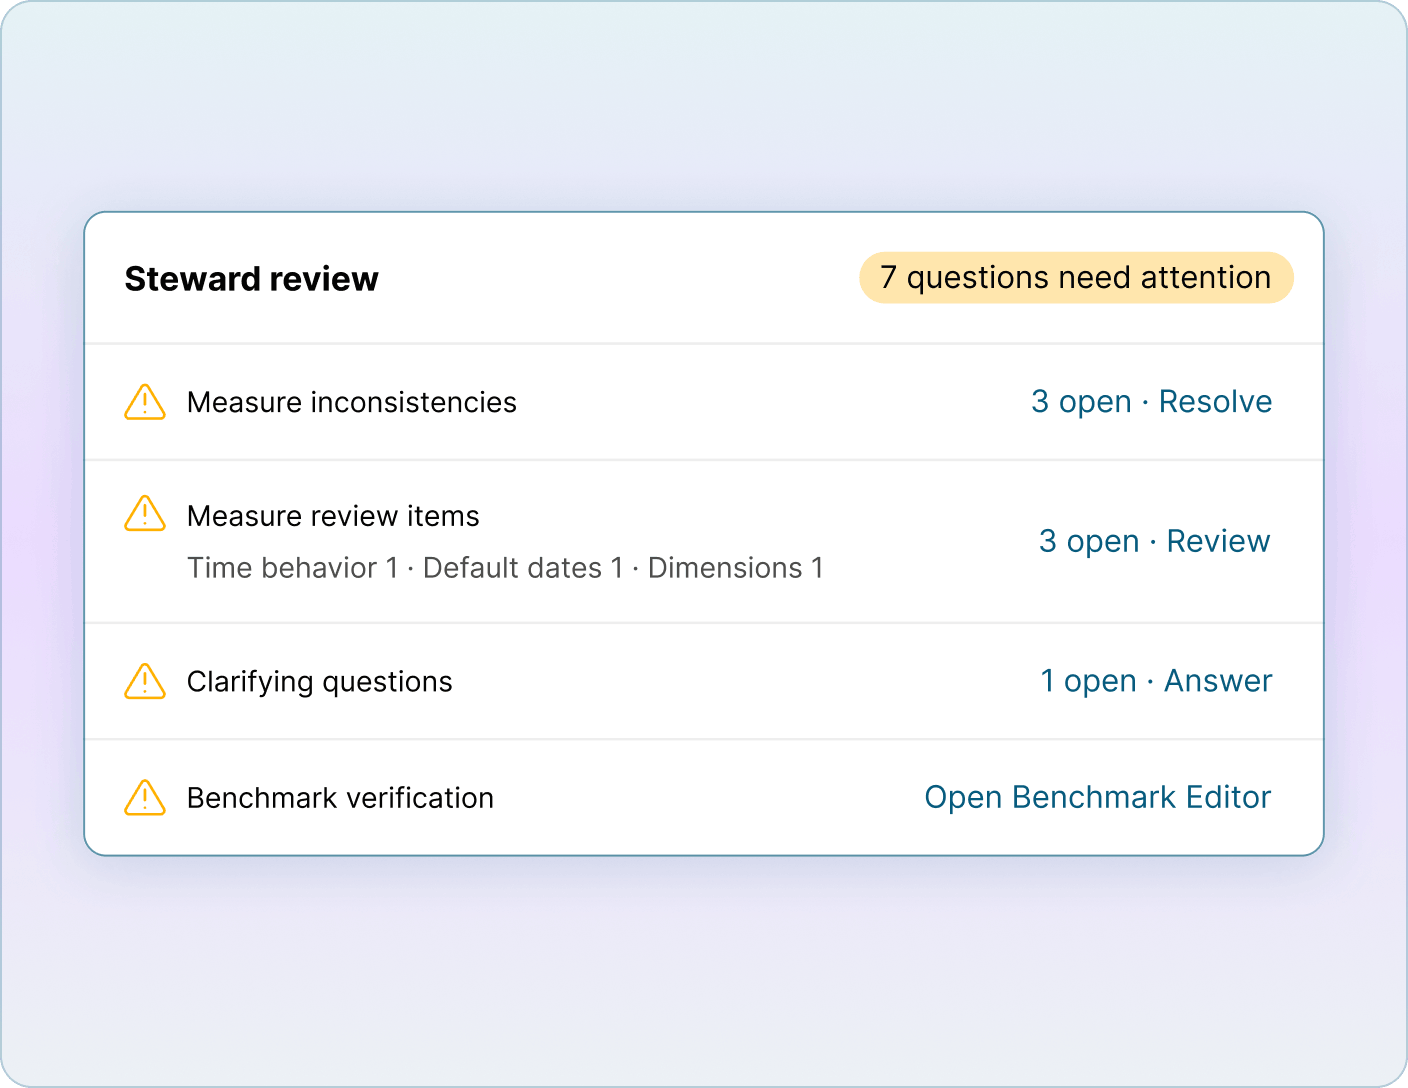
Steward review with seven questions that need attention, including measure inconsistencies, review items, clarifying questions, and benchmark verification.

Data stewards stay
in control

When something can’t be settled from the data, the Knowledge Graph asks instead of guessing. Stewards review clarification cards and resolve measure inconsistencies where two models show different values.

Verify with benchmarks

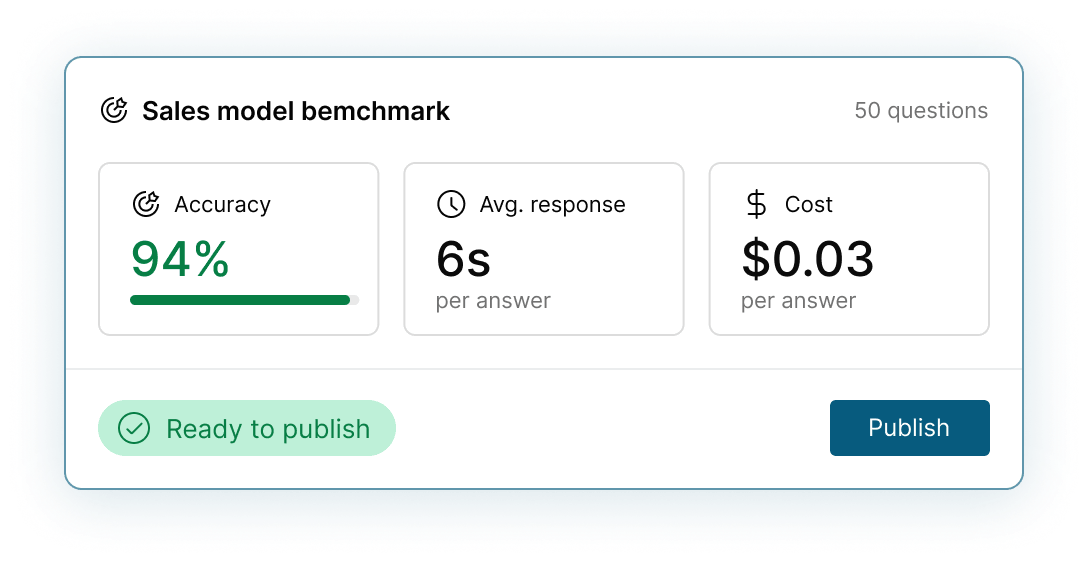
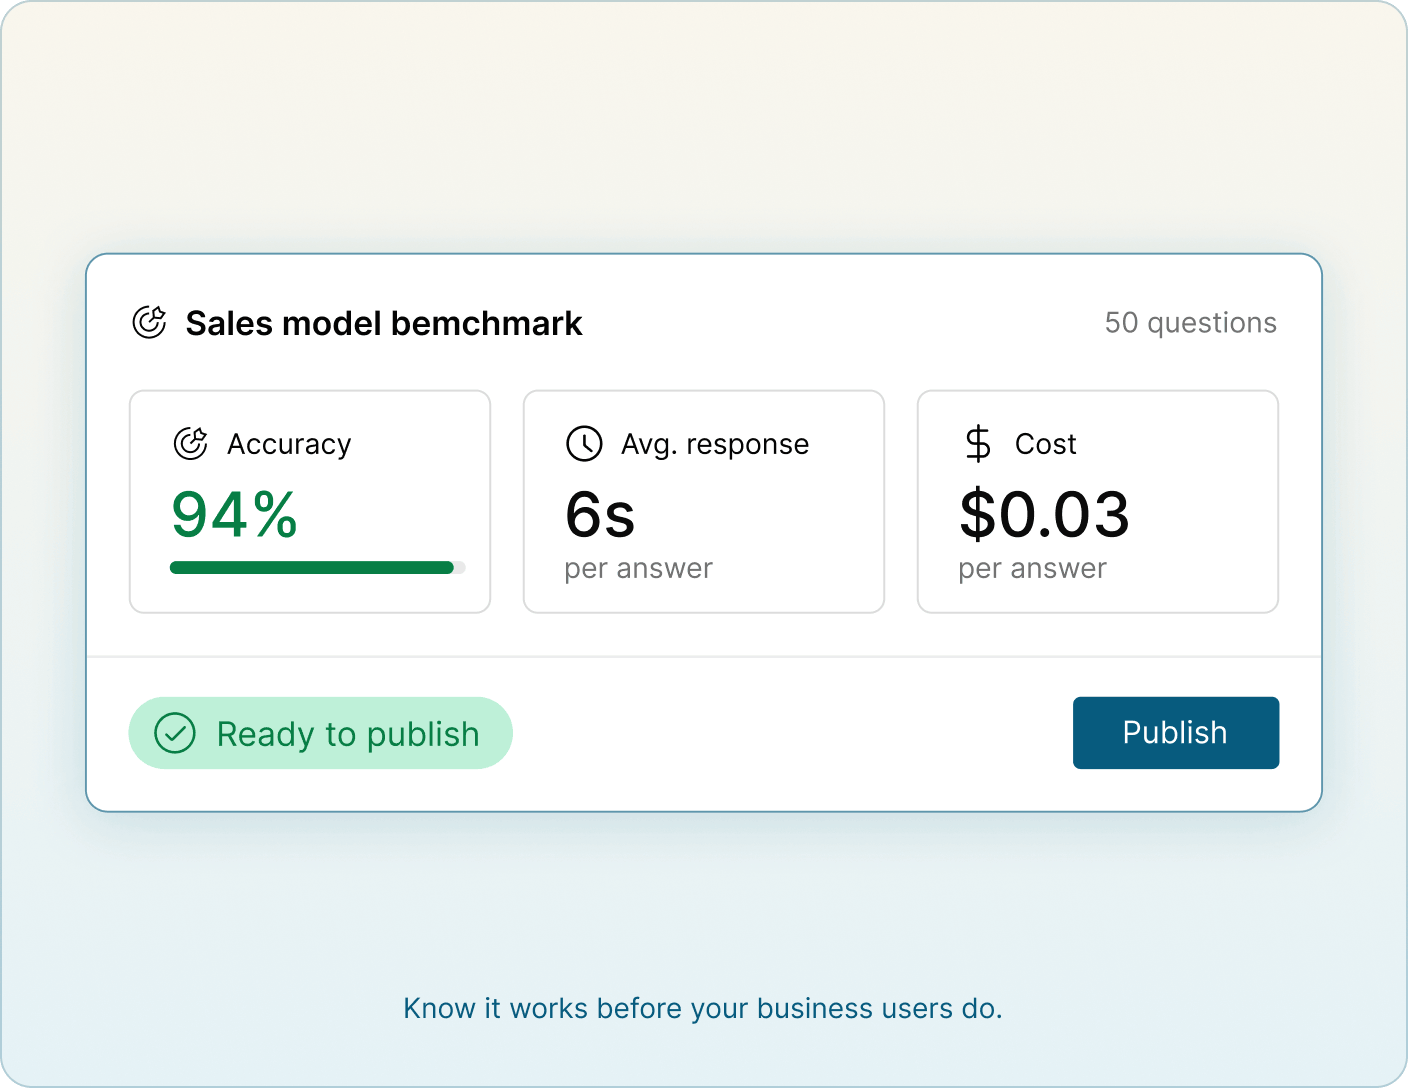
Run Concierge against a set of real business questions with known answers before you publish a model. Benchmarks show how accurate the answers are, how fast they arrive and what each one costs, so you can fix gaps early and roll out with confidence.
Sales model benchmark with 94 percent accuracy, a 6 second average response, and a cost of 3 cents per answer, ready to publish.

Know it works before your business users do.
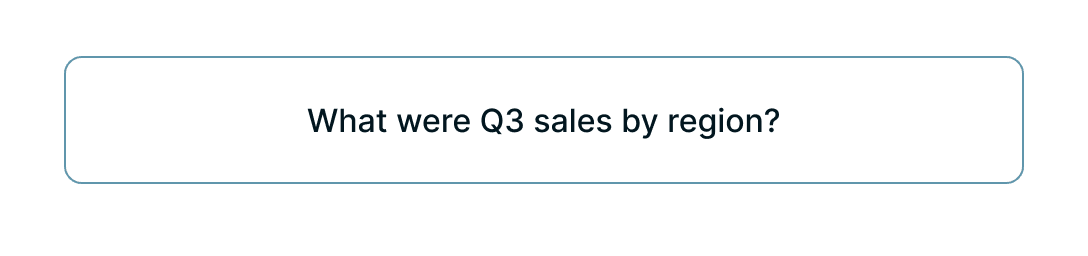
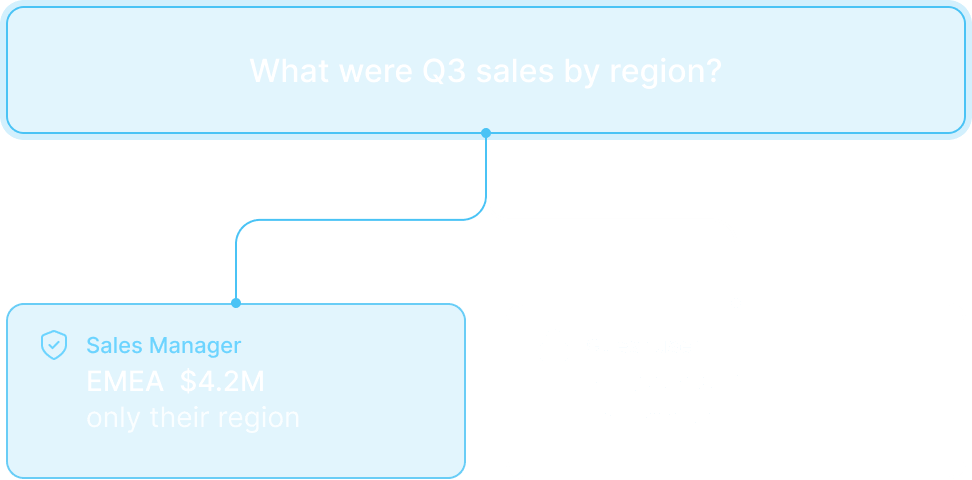
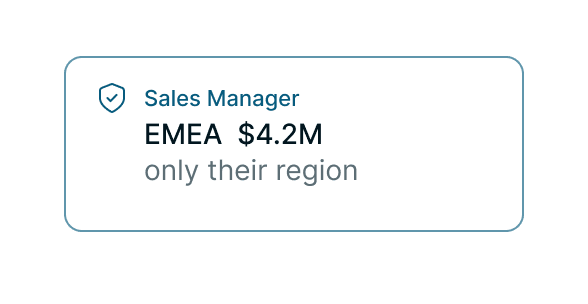
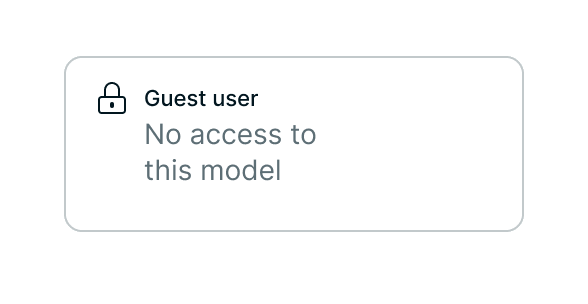
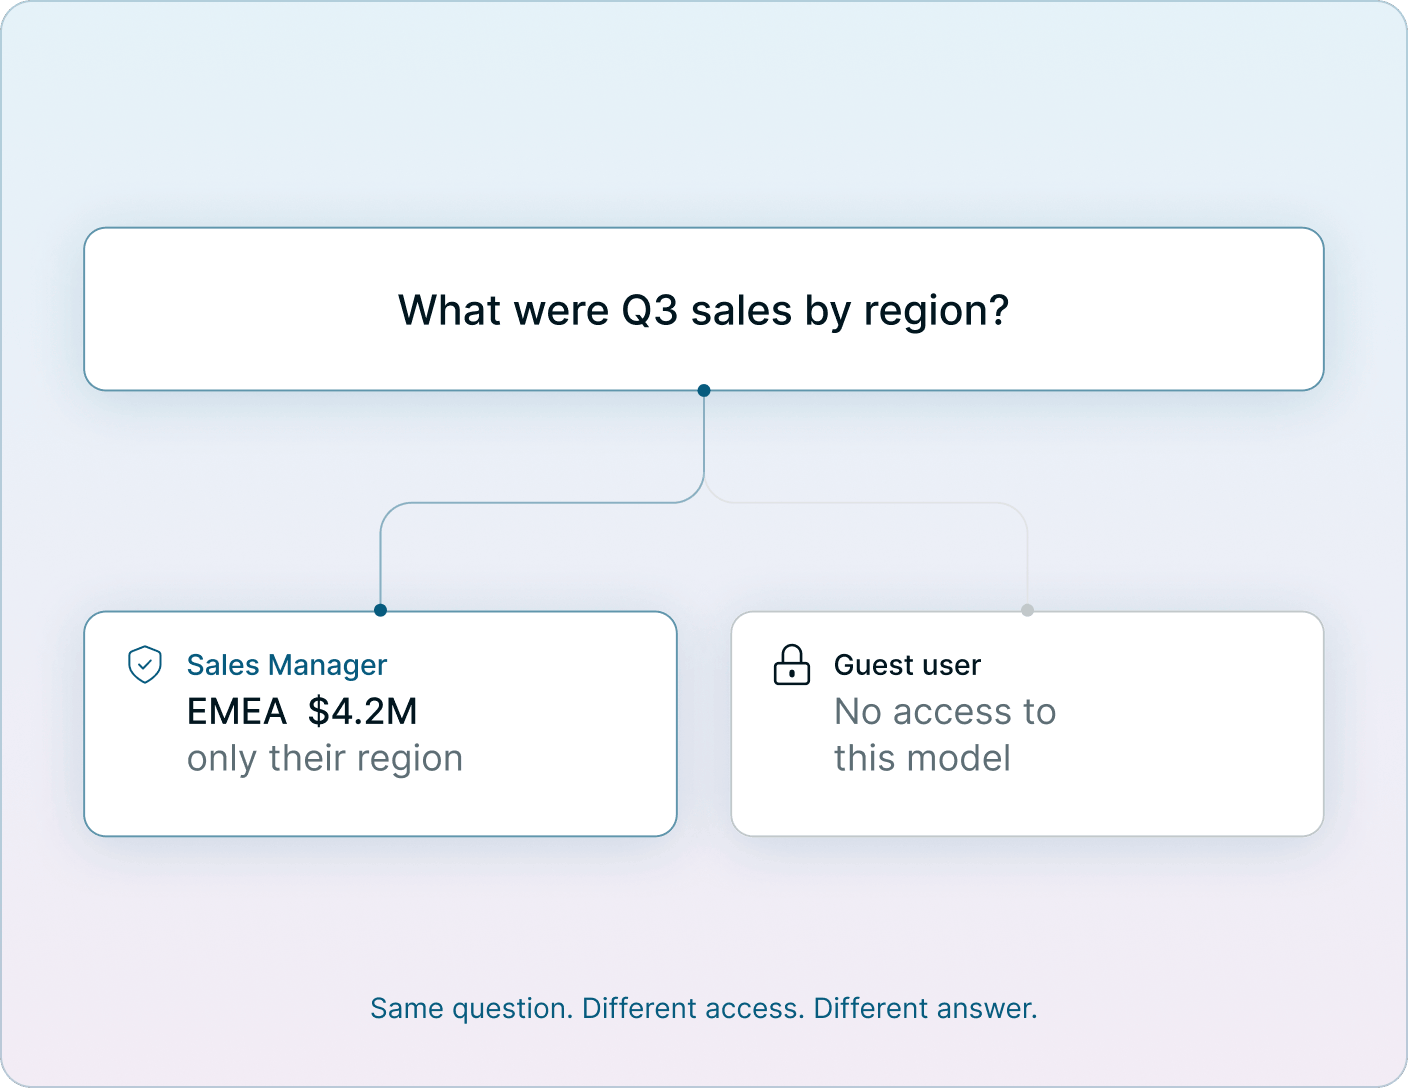
What were Q3 sales by region? Sales Manager sees EMEA $4.2M for only their region. Guest user has no access to this model.

Same question. Different access. Different answer.
Governed by design

Access is controlled per model, and publishing makes a model’s knowledge available to Concierge only when it’s ready. Admins can monitor learning activity and graph health from one place, so AI answers stay within the boundaries your organization sets.
NEXT
Learn about Talk to Your Data