Why is data literacy important?
In most organizations Data Analysts spent countless hours creating reports and visualizations while data scientists use artificial intelligence and machine learning to uncover deep insights about the business. However, if the tools and processes are not in place to promote the data literacy skills of business leaders, the work performed by business intelligence professionals is often in vain as it does not inform critical decision-making.
Achieving a high level of data literacy
Chief data officers will often assume that a digital transformation effort that leverages data science and modern BI Tools will driver business users to become data literate. Unfortunately, without a roadmap that implements processes and tools to build data literacy competencies within the organization, the digital transformation effort will simply yield more data visualizations and insights that are unused by decision makers. Fostering strong data literacy skills is required to unlock the true business value from analytics. To achieve this goal, business users must have the tools to easily:
- Find trusted data visualizations that are relevant to their needs.
- View analytics in context to understand the algorithms and meaningful information behind the data.
- Access the extended metadata that applies to the data analysis based on established enterprise data governance standards.
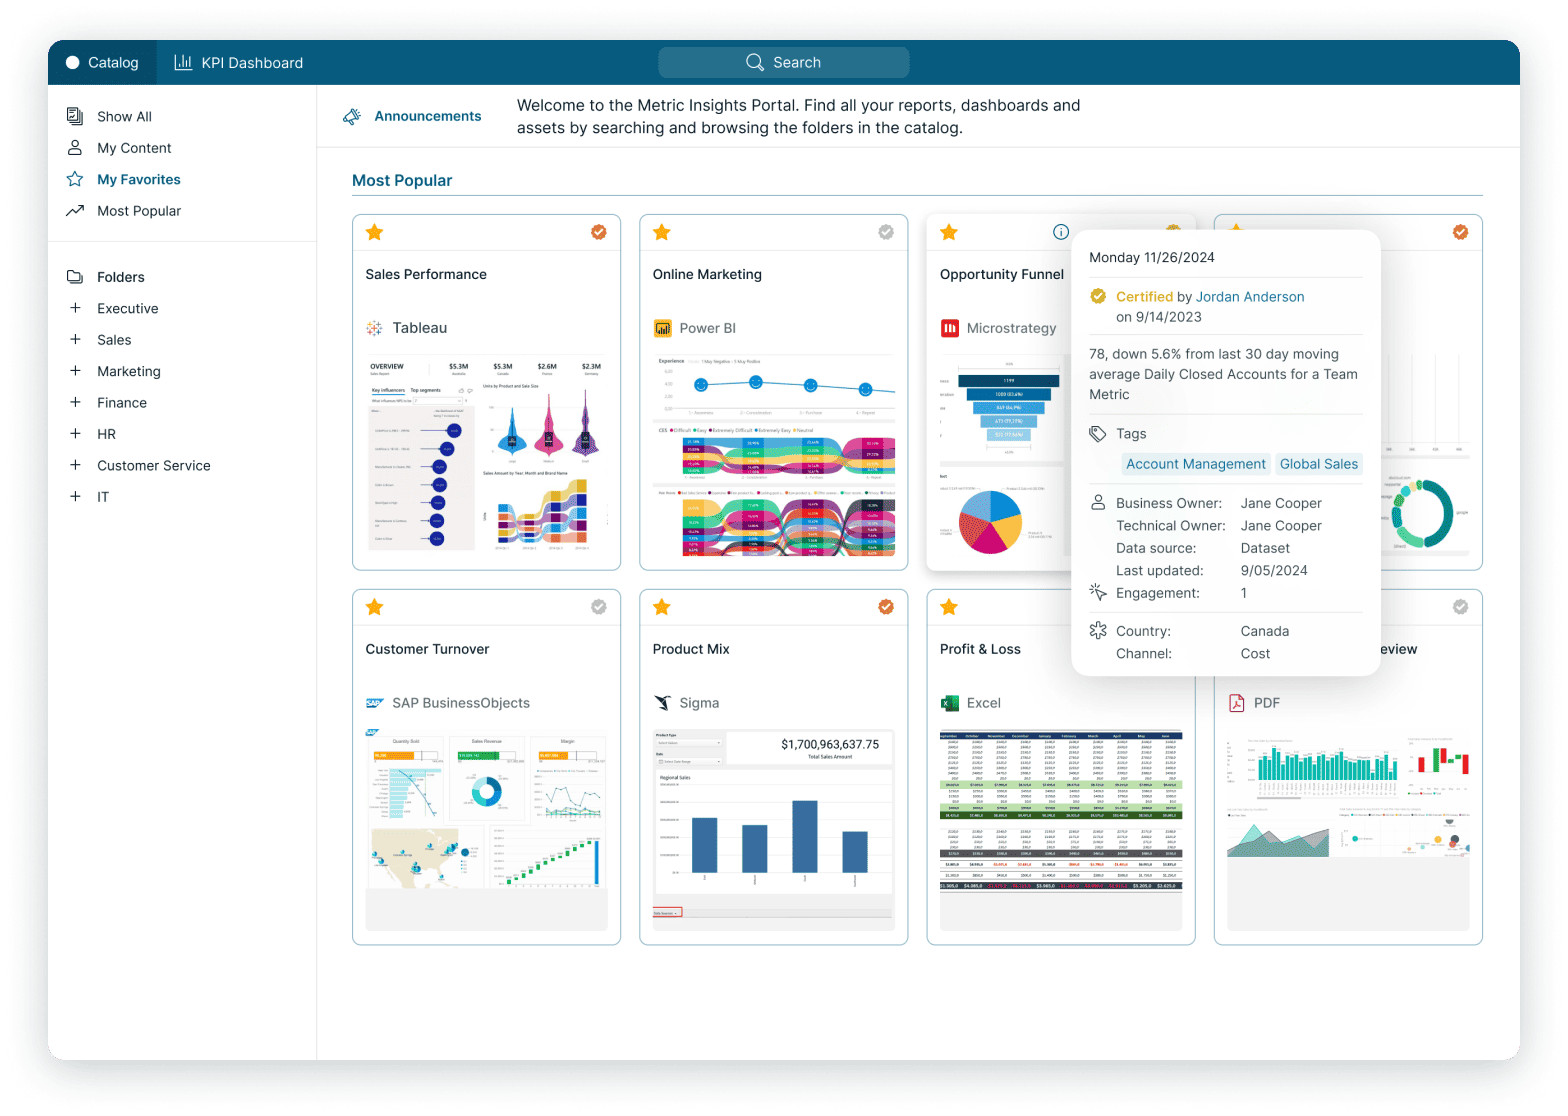
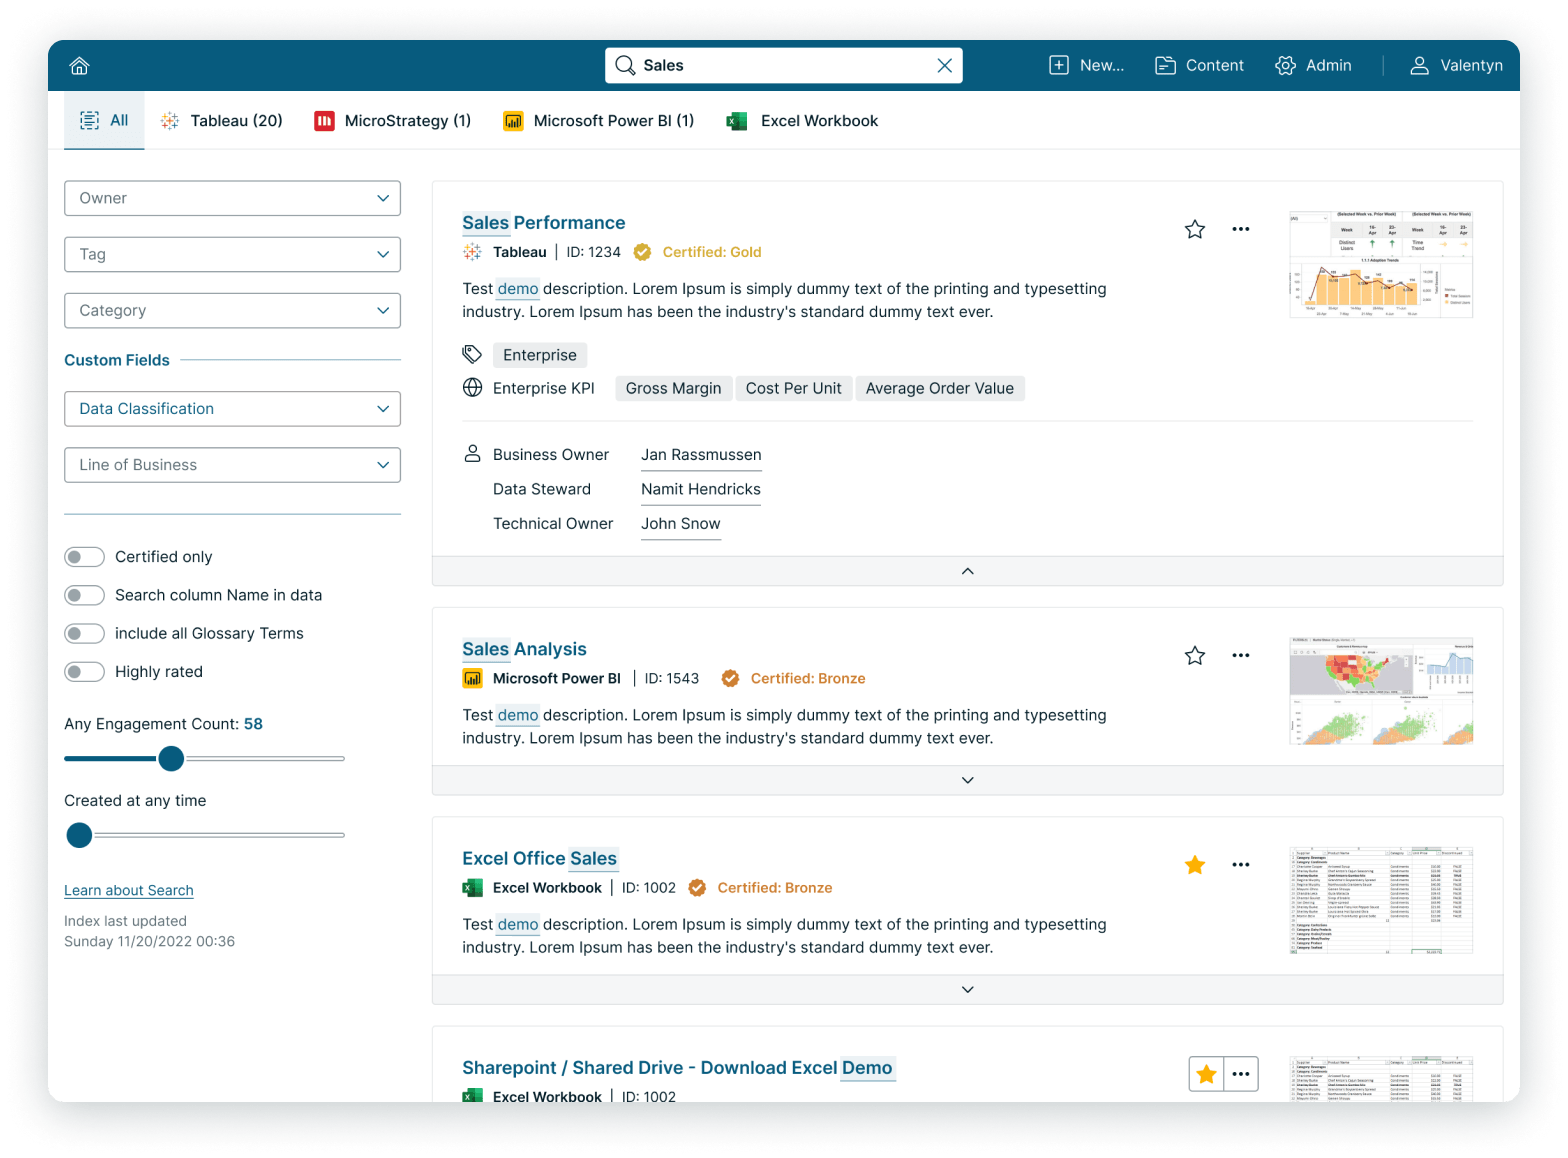
Finding Trusted Data Visualizations
To create a data-literate culture, users must have the ability to quickly locate the appropriate business intelligence application that addresses their inquiry. The Metric Insights portal supports the organization, certification, and tagging of all enterprise analytics assets whether these are reports generated through traditional BI Tools, Data Science Analysis built using R and Python using big data, or excel spreadsheets created by business analysts. The Metric Insights Portal creates a single unified data analysis interface for accessing those analytics that inform better decisions.
Placing Analytics in the Proper Context
One of the major roadblocks that business users face when they encounter a visualization is the lack of appropriate context for the data. Understanding what business rules and algorithms were used to generate the data is essential to a meaningful understanding of the data. The Metric Insights Portal enables content publishers to attach this type of information directly to the visualization as well as track any changes that occur via release notes. This critical functionality ensures that business users comprehend the meaning behind the numbers.
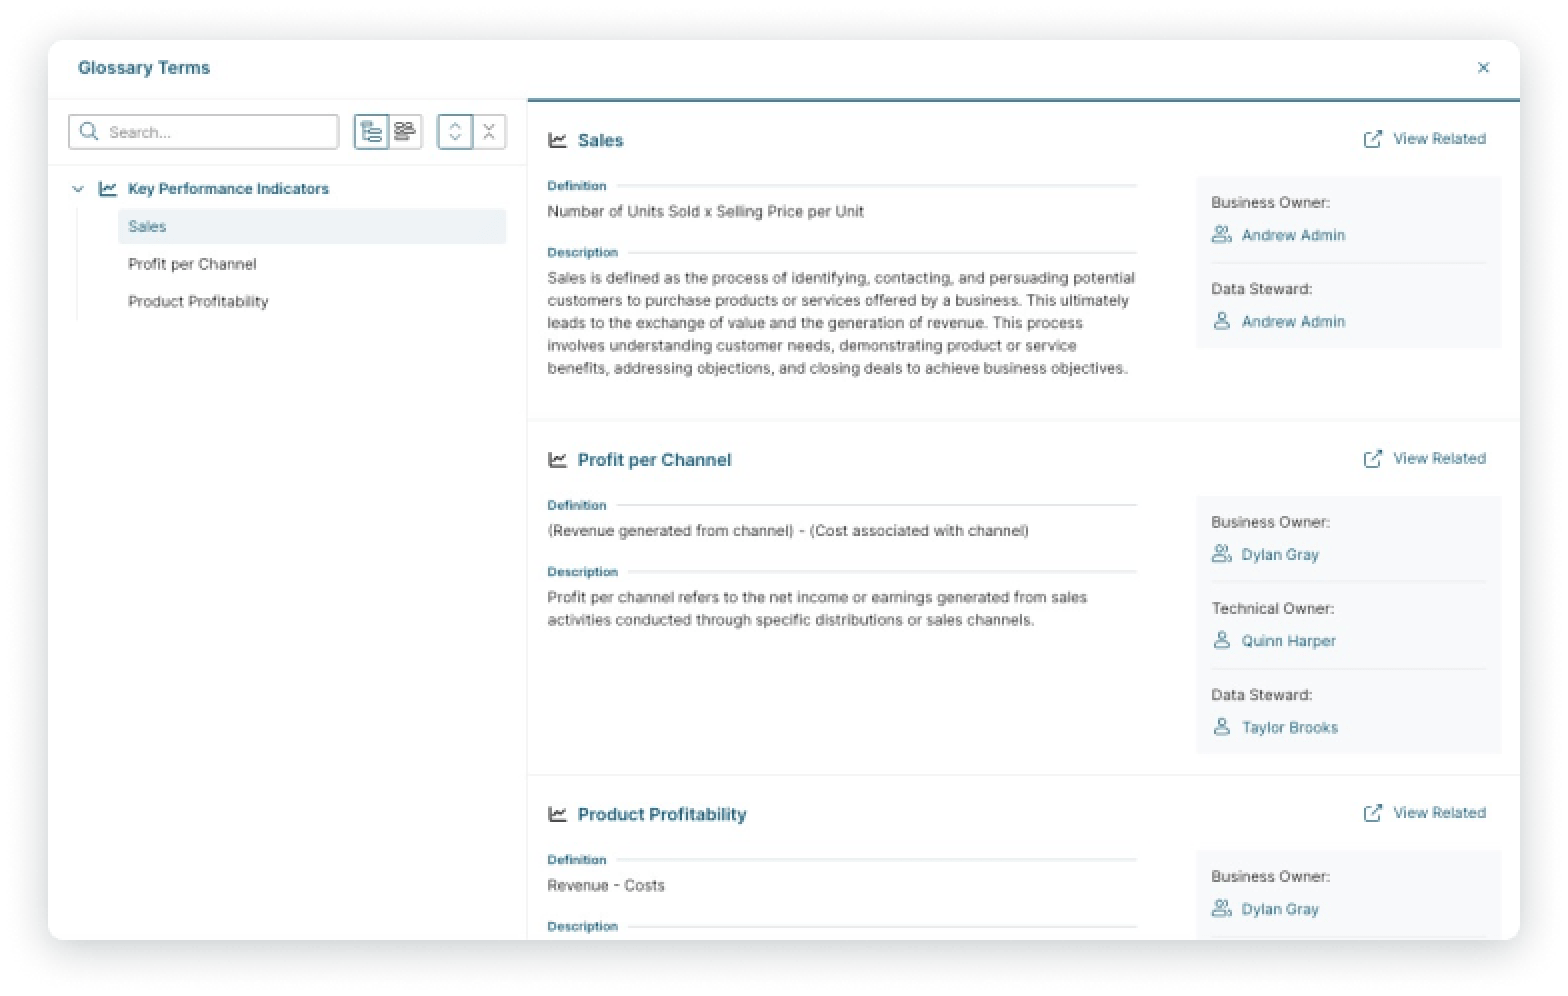
Accessing Extended Metadata
Mastering the language of data requires not only access to the correct metrics but the contextual understanding needed to analyze data and draw critical conclusions from the meaningful information. Every organization captures metadata that is critical to effective data management. This can include flagging of PII data, identification of data stewardship for analytics, or key lineage information. This metadata is often collected in separate metadata management tools like Collibra or Alation or resides in custom-built applications or large excel spreadsheets. Metric Insights can import this critical metadata from any source and makes this Metadata available to business users thereby making their search for answers an informed data literate journey.
To learn more about how Metric Insights can help you foster critical thinking and improve data literacy in your organization, watch our
on-demand Webinars.